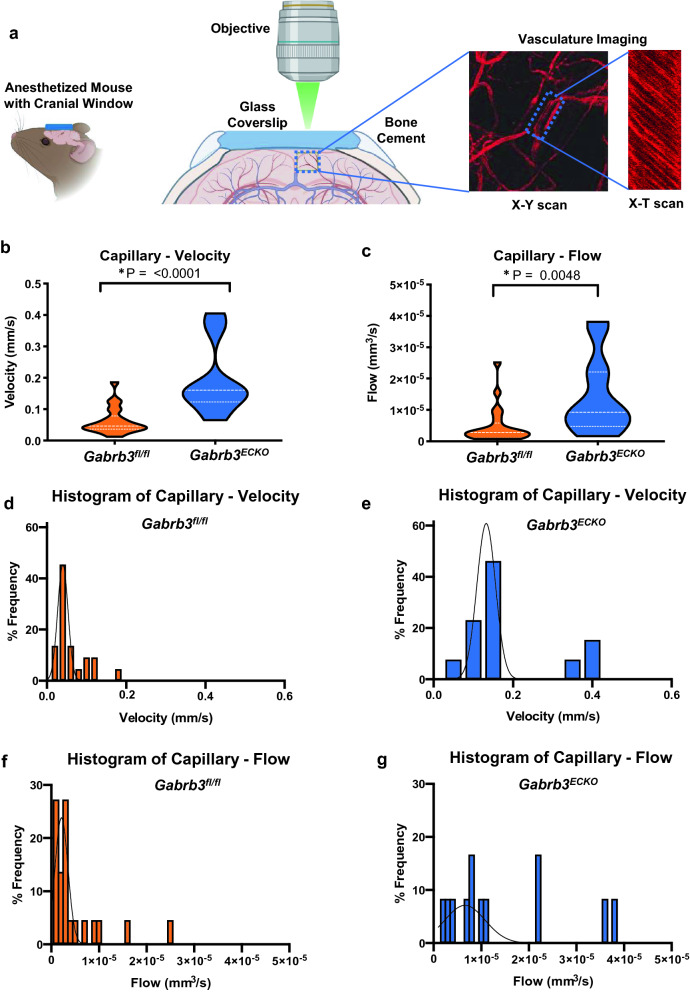
Figure 1.
Blood flow changes in Gabrb3ECKO mice. (a) Schematic of blood flow velocity acquisition by MPLSM. Using TAMRA–dextran contrast enhanced angiography; region of interest is first identified. Then, line scan images along the central axis of individual blood vessels (x-t) are acquired. Dark streaks (negative contrast) correspond to RBCs moving along the central axis of the blood vessel. The slopes of these streaks correspond to the RBC velocities. Data are presented in violin plots (*P < 0.05, Student's t-test). (b) Violin plot showing distribution of RBC velocities in capillaries (n = 22, n = 13 vessels, respectively). (c) Violin plot showing distribution of blood flow in capillaries of Gabrb3fl/fl and Gabrb3ECKO mice (n = 22, n = 12 vessels, respectively). (e–g) Histograms of RBC velocity and blood flow in the capillaries in the Gabrb3fl/fl versus Gabrb3ECKO mice.

