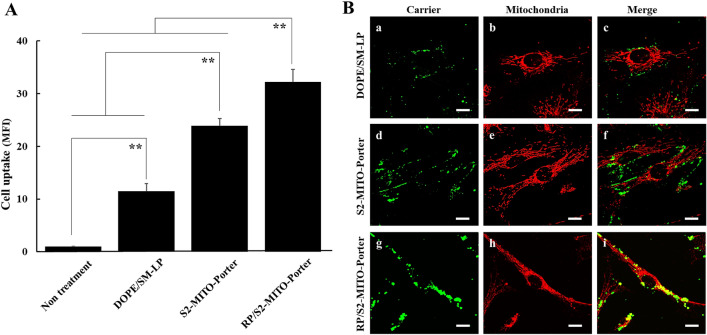
Figure 3.
Intracellular observation of MITO-Porter (RES). (A) Cellular uptake of RP/S2-MITO-Porter (RES), S2-MITO-Porter (RES) and DOPE/SM-LP (RES) labeled with NBD-lipids were evaluated by flow cytometry, using CPCs. The quantitative analysis of cellular uptake using the mean fluorescence intensity (MFI) of the carriers. Data are represented as the mean with S.D. (n = 3). The significant differences were calculated using one-way ANOVA followed by SNK test (**p < 0.01). (B) Intracellular observation of DOPE/SM-LP (RES) (a–c), S2-MITO-Porter (RES) (d–f) and RP/S2-MITO-Porter (RES) (g–i) using CLSM. When green labeled carriers (green color) were co-localized with red stained mitochondria, yellow signals were observed in the merged image. Lines indicate the edges of the cells. Scale bars 20 μm.

