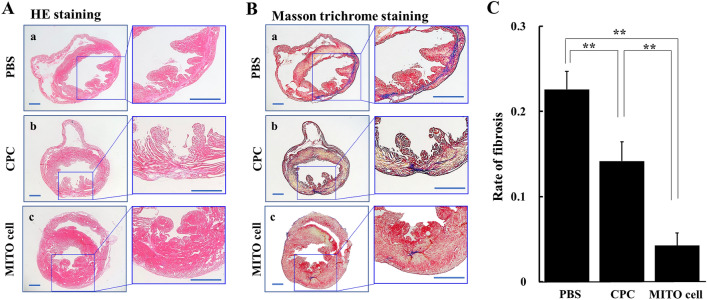
Figure 6.
HE and Masson trichrome straining in ischemic myocardium after cell transplantation. HE staining (A) and Masson trichrome staining (B) in sections of ischemic myocardium 30 days after treatment in each group (PBS group (a), CPC group (b), MITO-cell group (c)). Left panels are magnified images of interest of region. Scale bar is 200 μm. (C) The photographic images shown in (B) were analyzed to determine the rate of fibrosis using Image-pro Plus 7.0. PBS, PBS treated; CPC, CPC transplanted; MITO cell, MITO cell transplanted. Data are represented as the mean ± S.D (n = 5). Significant differences (**p < 0.01) were calculated by one-way ANOVA, followed by the SNK test.

