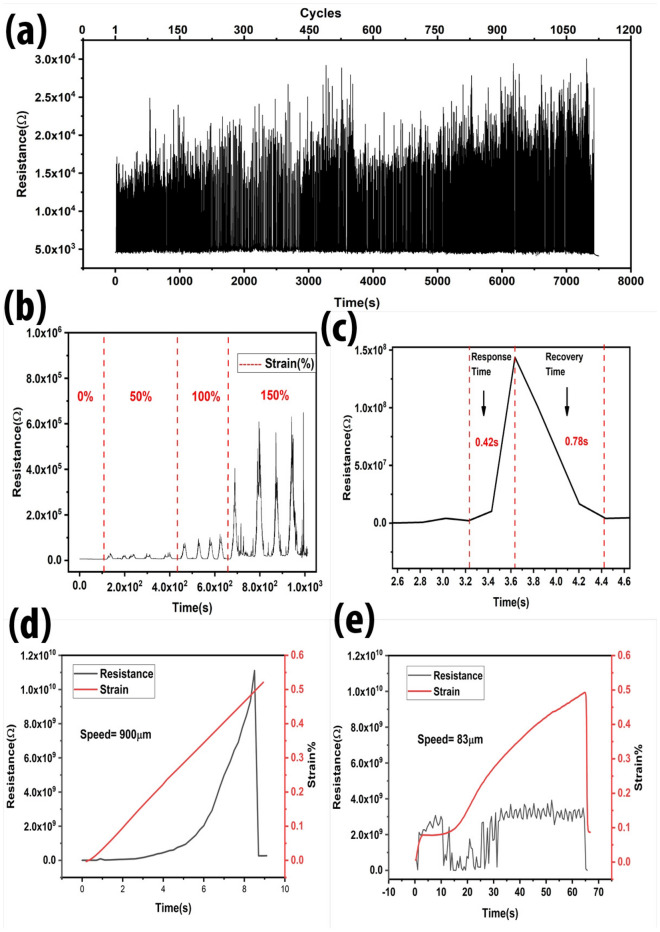
Figure 5.
Sensor stability tests including (a) cyclic performance of strain sensor showing more than 1000 cycles at the strain range of 80 to 120%. (b) Sensor performance during different strain, for 0, 50%, 100%, and 150% strain. Resistance increases gradually after increasing the strain percentage. (c) Response time and recovery time was calculated as ~42 ms and ~78 ms, respectively. (d) Strain speed of 900 μm/s and (e) 83 μm/s was applied to the strain sensor to observe the sensor behaviour.

