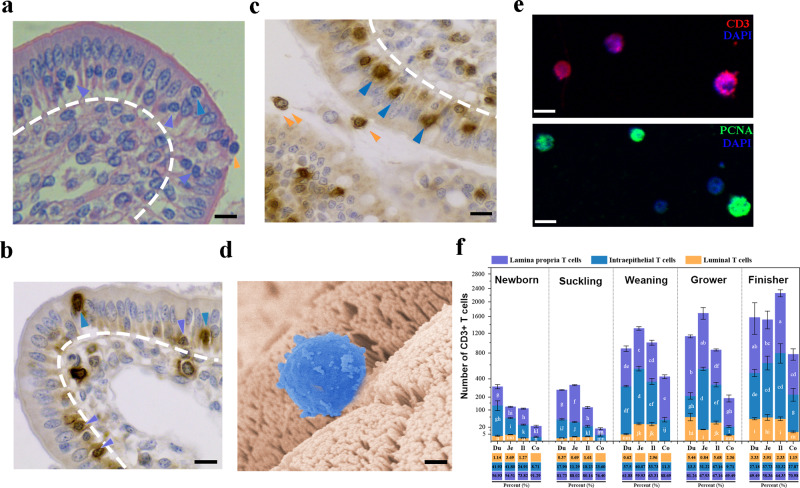
Fig. 1. The distribution of porcine intestinal intraepithelial lymphocytes (IELs).
a Hematoxylin and eosin (HE) staining showing the distribution of IELs in the basal surface (white arrowheads), lateral intercellular space (LIS) (black arrowheads), or free-surface (red arrowheads) of epithelial layer in jejunum tissues (45-day-old piglets). Scale bars, 10 μm. b Representative images of the CD3-positive IELs in the basal (white arrowheads) or intraepithelial of jejunal epithelia (black arrowheads) (45-day-old piglets). Scale bars, 10 μm. c Representative images of the CD3-positive IELs located in LIS (black arrowheads) or free-surface (red arrowheads) of jejunal epithelia (45-day-old piglets). Scale bars, 10 μm. d Representative SEM image showed the luminally located IELs (blue) in jejunum tissue (45-day-old piglets). Scale bars, 5 μm. e IELs were isolated from ileal contents and stained for CD3 and PCNA protein. The scale bar represents 10 μm. f Quantitative analysis of IELs within various intestinal segments collected from pigs (n = 3) in different growth stages. The numbers of CD3-positive cells in different sites of the intestinal epithelial layer were counted in 20 random intestinal villi. The frequency of total T cells in each area (%) was presented in the bar chart. All data shown are the mean results ± SD from three independent experiments. Statistical significance was shown using one-way ANOVA. NS: no significance; *P < 0.05, **P < 0.01. The differences are indicated by different letters. Letters above the graphs indicate statistical significance in which treatments with a letter in common are not significantly different from each other.

