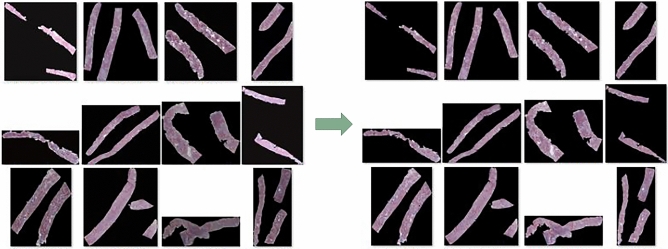
Figure 2.
Example images of biopsy samples. Multiple cortexes are combined in each case. To reduce the color and intensity variations present in the stained images, we computed the global mean and standard deviation of each channel in the Lab color space for the Reinhard color normalization for all data and used them as reference values to normalize our data. The figure shows Reinhard color normalization before (left) and after (right).

