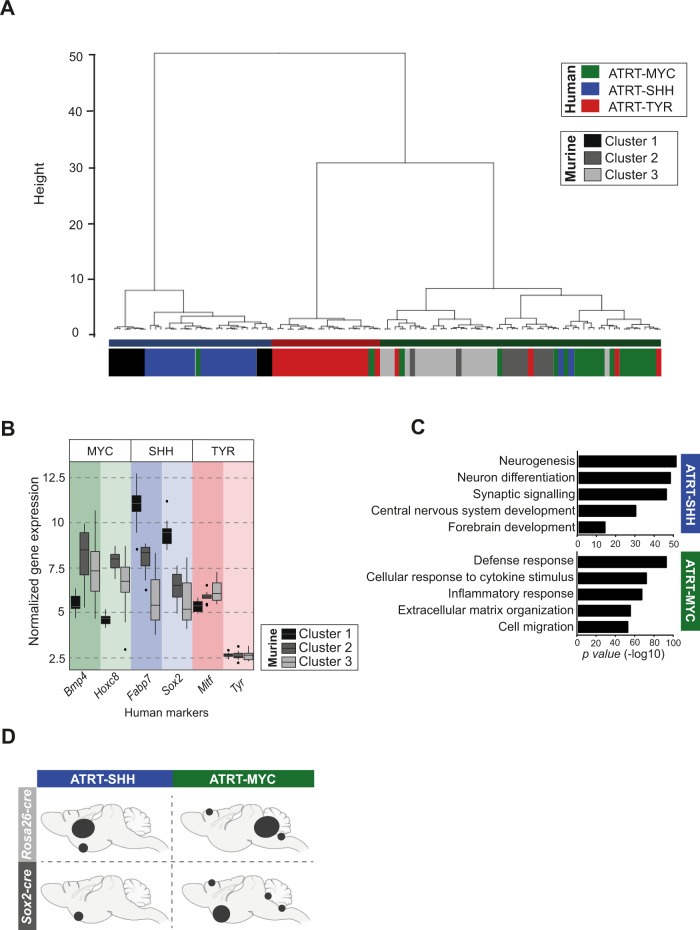
Fig. 2. Murine tumors recapitulate features of human rhabdoid tumors.
A Unsupervised hierarchical clustering of 67 human ATRT samples7, 83 and 41 murine RT samples derived from Sox2-cre, Sox2-creERT2 Smarcb1 and Rosa26-creERT2::Smarcb1fl/fl knockout models. Subgroup annotation for human tumors was derived from the original publication. Three clusters of murine samples were found by dimensionality reduction and clustering. B Boxplots display the expression of known marker genes of each RT human subgroup, in the three murine clusters (n = 41 biologically independent samples, grouped into cluster1: n = 10 samples; cluster2: n = 11 samples and cluster3: n = 20 samples). For each box, the lower and upper bounds represent the 25th and 75th percentiles; the center corresponds to the 50th percentile (median). The upper whisker extends to the largest value no further than 1.5 * IQR from the bound (where IQR is the interquartile range, or distance between the 25th and 75th percentiles). The lower whisker extends to the smallest value at most 1.5 * IQR of the bound. Data beyond the end of the whiskers are called outlying points and are plotted individually. C Gene ontology (GO) analysis of upregulated differentially expressed genes (DEGs) of murine ATRT-SHH versus ATRT-MYC samples. Only significantly enriched GO terms are shown (x-axis, −log10 scale). The R package limma86 was used for differential expression analysis (adjusted p-value by Benjamini & Hochberg method with threshold = 0.01; logFC threshold = ±2). Functional annotation was performed using ToppGene Suite87 (with statistical method as probability density function) considering GO terms enriched with an adjusted p-value (FDR) < 0.05. D Schematic representation indicates preferential brain areas of ATRT-SHH and ATRT-MYC tumors in Sox2-cre, Sox2-creERT2 (n = 18) and Rosa26-creERT2 Smarcb1 (n = 9) knockout models (dot sizes depict the frequency of occurrence). See also Supplementary Figs. 4, 5, and source data file.

