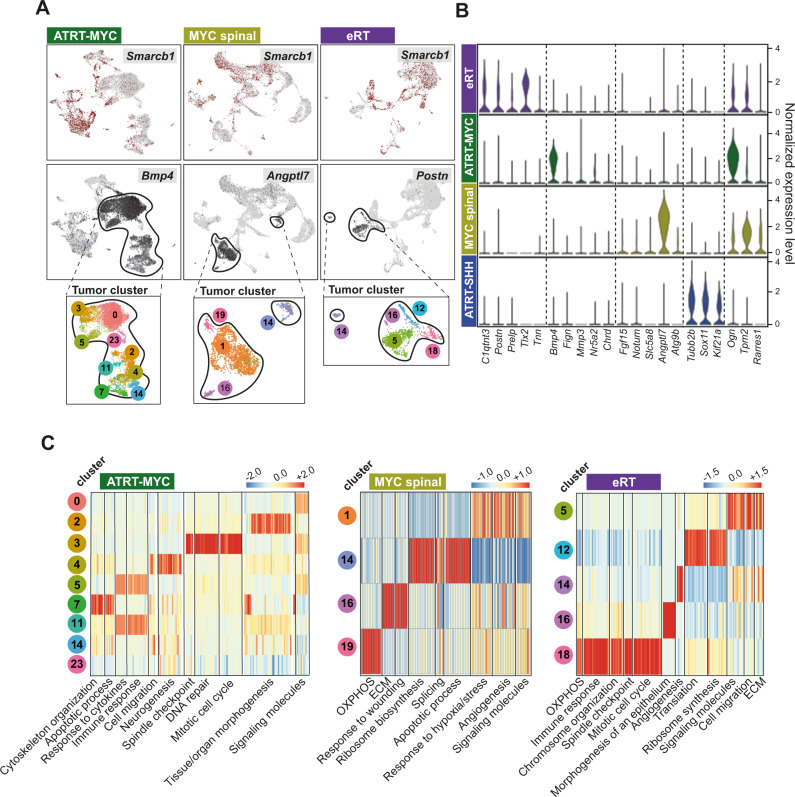
Fig. 3. RT of different localizations share repetitive transcriptional programs.
A UMAP plots show clustering of murine MYC tumor single-cell transcriptomes subdivided into ATRT-MYC (left, n = 5 samples), MYC tumors from the spinal canal (middle, referred to as MYC spinal, n = 3 samples) and eRT (right, n = 3 samples). Smarcb1-negative tumor cells (upper row) and expression of the exemplary MYC subtype-specific genes depict tumor clusters (TCs) (circled clusters, TC numbers are indicated in magnified insets). B Violin plots depict gene expressions of top-ranked localization-specific tumor markers derived from DE analysis comparing only tumor cells of all three MYC subtypes. C Heatmaps show the upregulated expression of functional gene classes across individual TCs of the three MYC subtypes. See also Supplementary Fig. 6 and source data file.

