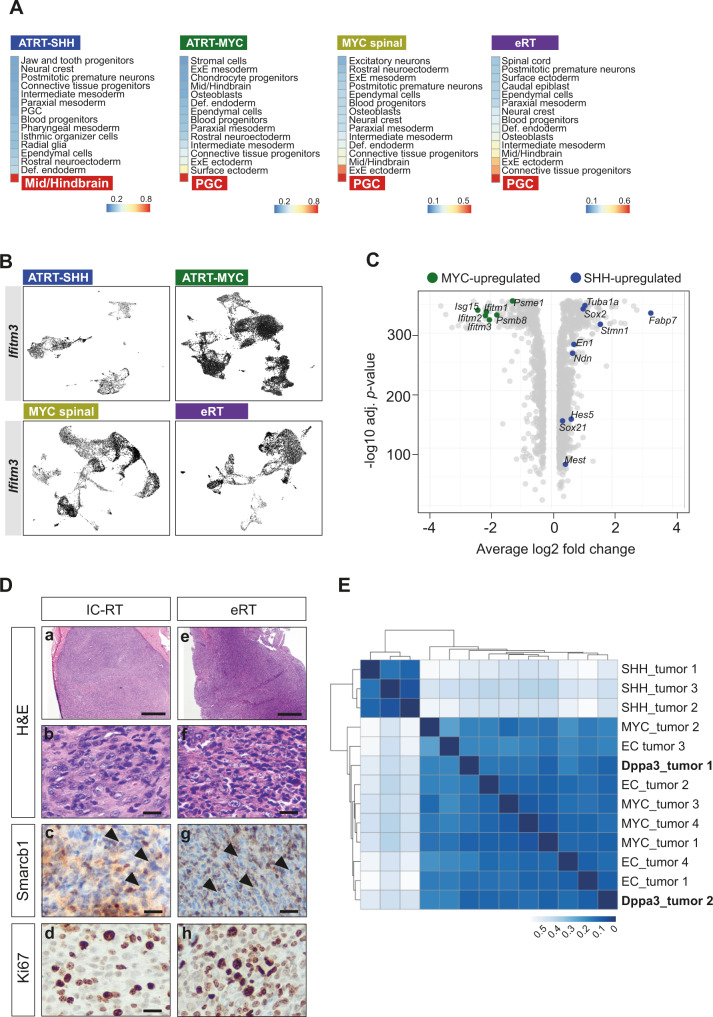
Fig. 4. Murine SHH and MYC tumors arise from distinct cells of origin.
A Similarity scores of different murine RT subtypes and embryonal cell types as calculated by logistic regression. Colors represent the probability of high (red) to low (blue) similarity. Complete results with scores at the single-cell level are shown in Supplementary Fig. 8. B UMAP plots of Ifitm3-expressing cells in ATRT-SHH and MYC tumors of all three subtypes. C Volcano plot of up- (in ATRT-SHH) and downregulated (upregulated in ATRT-MYC) DEGs derived from the comparison between SHH and MYC tumor cells. Differential expression analysis was computed on the unintegrated data using MAST algorithm88. Statistically significant genes were considered having a q-value < 0.05 (Bonferroni correction). D Representative H&E stainings of intra- (n = 1) and extracranial (n = 1) tumor samples derived from Dpp3a-cre::Smarcb1fl/+ mice. Tumors were detected adjacent to the trigeminal nerve (a–d) or in the maxillary region (e–h). Both tumors present loss of Smarcb1 protein (c, g) and are highly proliferative, as indicated by Ki67 staining (d, h). Scale bars indicate 500 µm (a, e), and 20 µm in all remaining images. Arrowheads point at Smarcb1-negative cells. E Heatmap representing the inter-sample distances calculated between two murine samples derived from the Dpp3a-cre::Smarcb1fl/+ model and published murine RTs of the SHH, MYC and extracranial subgroups (GSE137633). Distances between samples are calculated as 1-correlation, while the hierarchical clustering uses Ward.D2 method. Only a subset of genes corresponding to known subgroup markers was considered prior to the distance calculation. See also Supplementary Figs. 7–10. Source data are provided as a Source data file.

