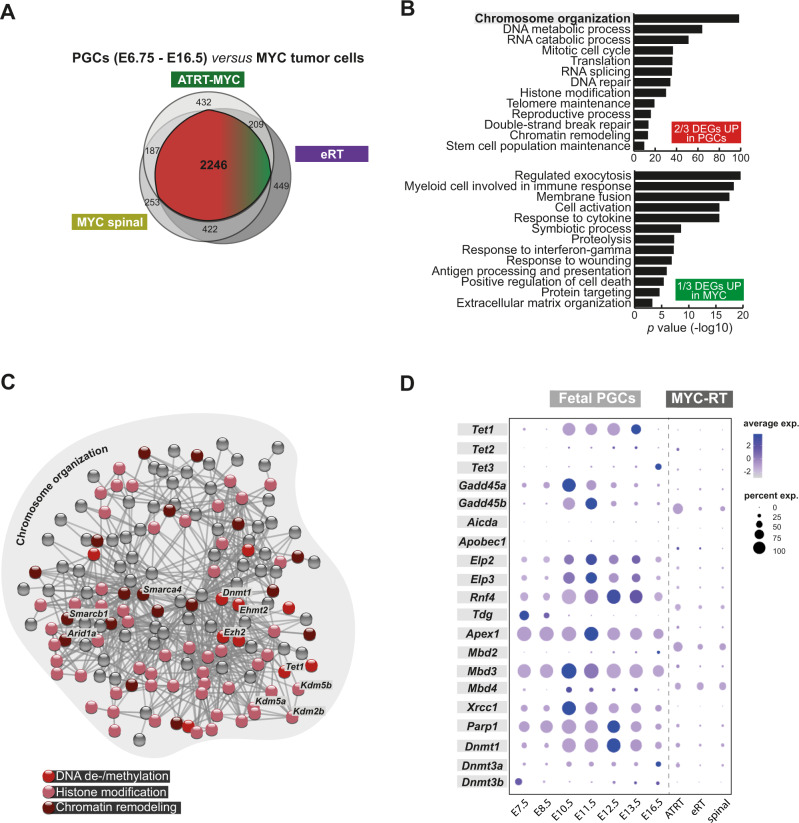
Fig. 5. RT of the MYC subgroup have a deregulated transcriptome and epigenome compared to PGCs.
A Venn diagram showing the overlap of DEGs derived from the comparison between PGCs (E6.75–E16.5)30,35 and MYC tumor cells of each subtype. Two-thirds of overlapping DEGs are upregulated (in PGCs, in red) and one-third are downregulated (upregulated in tumor cells, in green). B GO term analysis of the overlapping DEGs between PGCs and MYC tumor cells among all subtypes. Only significantly enriched GO terms were considered (x-axis, −log10 scale). Differential expression analysis used MAST algorithm88. Statistically significant genes were considered having a q-value < 0.05 (Bonferroni correction). Functional annotation was performed using ToppGene Suite87 (with statistical method as probability density function) considering GO terms enriched with an adjusted p-value (FDR) < 0.05. C STRING interaction network of shared upregulated DEGs (upregulated by PGCs) related to the GO term annotation ‘chromosome organization’. Each dot represents one gene. Major cellular functions are indicated by different colors and exemplary genes are highlighted. D Dotplot representing the expression of selected epigenetic-related genes in fetal PGCs (E7.5–E11.5) and the three MYC subtypes (MYC spinal, eRT and ATRT-MYC). See also Supplementary Fig. 11 and source data file.

