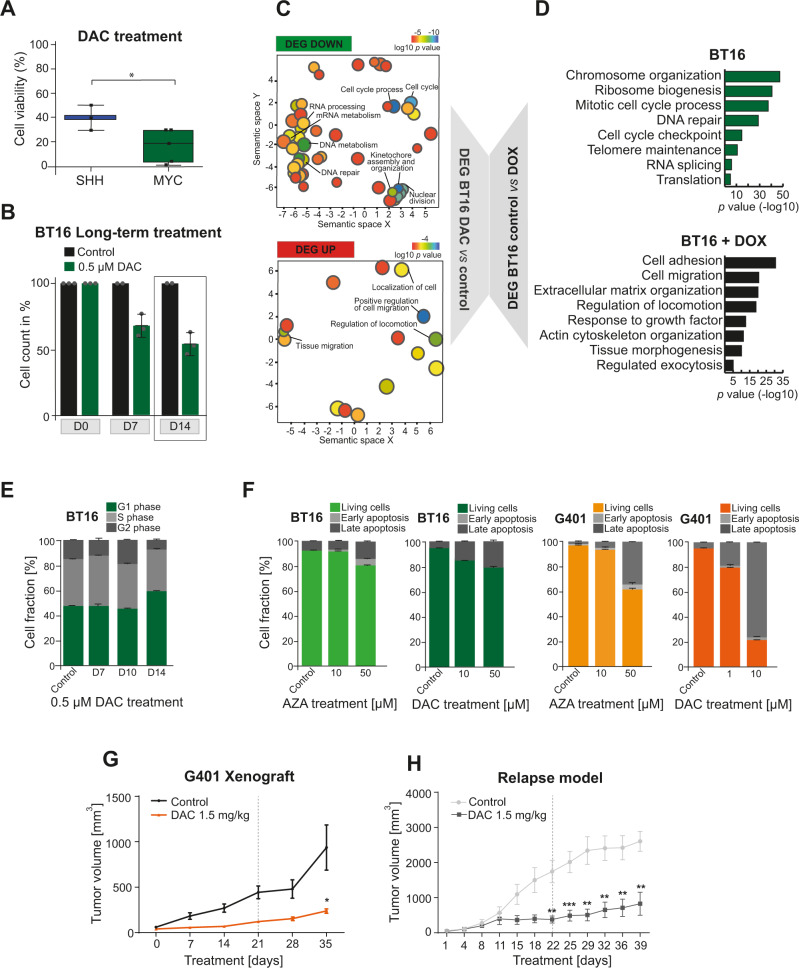
Fig. 7. Counteracting epigenetic imbalance in MYC tumors through targeted therapy.
A Eight human RT cell lines (3 for SHH and 5 for MYC subgroups) was tested for viability after 6 days decitabine (DAC) treatment (1 µM). A remarkable decrease in cell viability was observed in both subgroups, though the effect on MYC cells was more pronounced. (Unpaired-t-test, two-tailed, *p = 0.064). For each box, the lower and upper bounds represent the 25th and 75th percentiles; the center corresponds to the 50th percentile (median). The whiskers go down to the smallest value and up to the largest. B Graph depicts the cell number of DAC-treated BT16 (ATRT-MYC) cells over time. n = 2/3 technical replicates. Mean ± SD is shown; gray dots indicate individual values. C Overrepresented functional categories of up- and downregulated DEGs of DAC-treated BT16 cells over 14 days compared to untreated cells, further subjected to microarray profiling. Functional categories are clustered and visualized based on similarity using REVIGO99. Size and color of circles represents the p values (log10 scale) derived from ToppGene87 (statistical method as probability density function) considering terms enriched with an adjusted p-value (FDR) < 0.05. D GO term analysis of DEGs between BT16 cells before and after SMARCB1 re-expression (BT16 + DOX) (data derived from Wang et al.59). Differential expression analysis was conducted with the R package DESeq295. Only genes with adjusted p-value < 0.05 were considered (Benjamini–Hochberg correction). Functional annotation was performed as in (C). Only significantly enriched GO terms were considered (x-axis, −log10 scale). E Stacked bar graph depicts cell cycle analysis of BT16 cells treated with vehicle or DAC over time. Analysis based on n = 2/3 technical replicates, mean ± SD is shown. F Stacked bar graphs showing apoptosis assay results of BT16 or G401 tumor cells treated with DAC or AZA (5-azacytidine) over 7 days. n = 3 technical replicates, mean ± SD is shown. Tumor volume curve of G NOD/SCID mice (engraftment of G401 cells) treated with DAC (n = 6) or vehicle (n = 8) (Unpaired, two-tailed T-Test; *p = 0.0258) and H of a PDX model of a relapsed eRT treated with vehicle (n = 7) or DAC (n = 7) (Unpaired multiple T-test; **p < 0.001, ***p < 0.001). See also source data file.

