. 2021 Dec 23;9(1):12–23. doi: 10.3934/Neuroscience.2022002

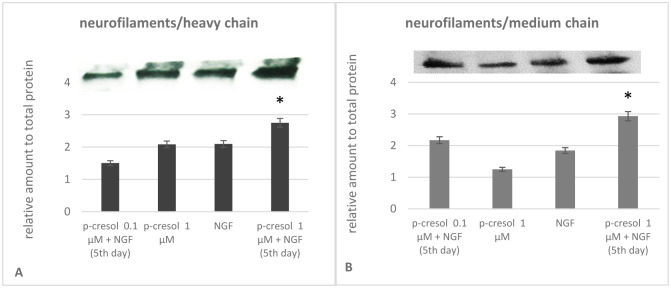
Figure 2. Analysis of the neurofilament (NF) heavy (H) and medium (M)-chain content in PC-12 cells. The cell lysates were loaded onto each well for immunoblotting, resolved by sodium dodecyl sulfate-polyacrylamide gel electrophoresis (SDS-PAGE), transferred to nitrocellulose membranes, and probed with NF-H/M antibodies. Bands from three experiments (n = 3) were quantified using Image J software (https://imagej.net/ImageJ). and plotted as a bar graph. Quantitative values represent mean normalized to total protein. The significance level was set at *p < 0.05, versus the NGF treated PC-12 cells. Data are derived from three independent experiments and are expressed as the relative change from the mean ± standard error of triplicate experiments' mean (SEM).

Figure 2.