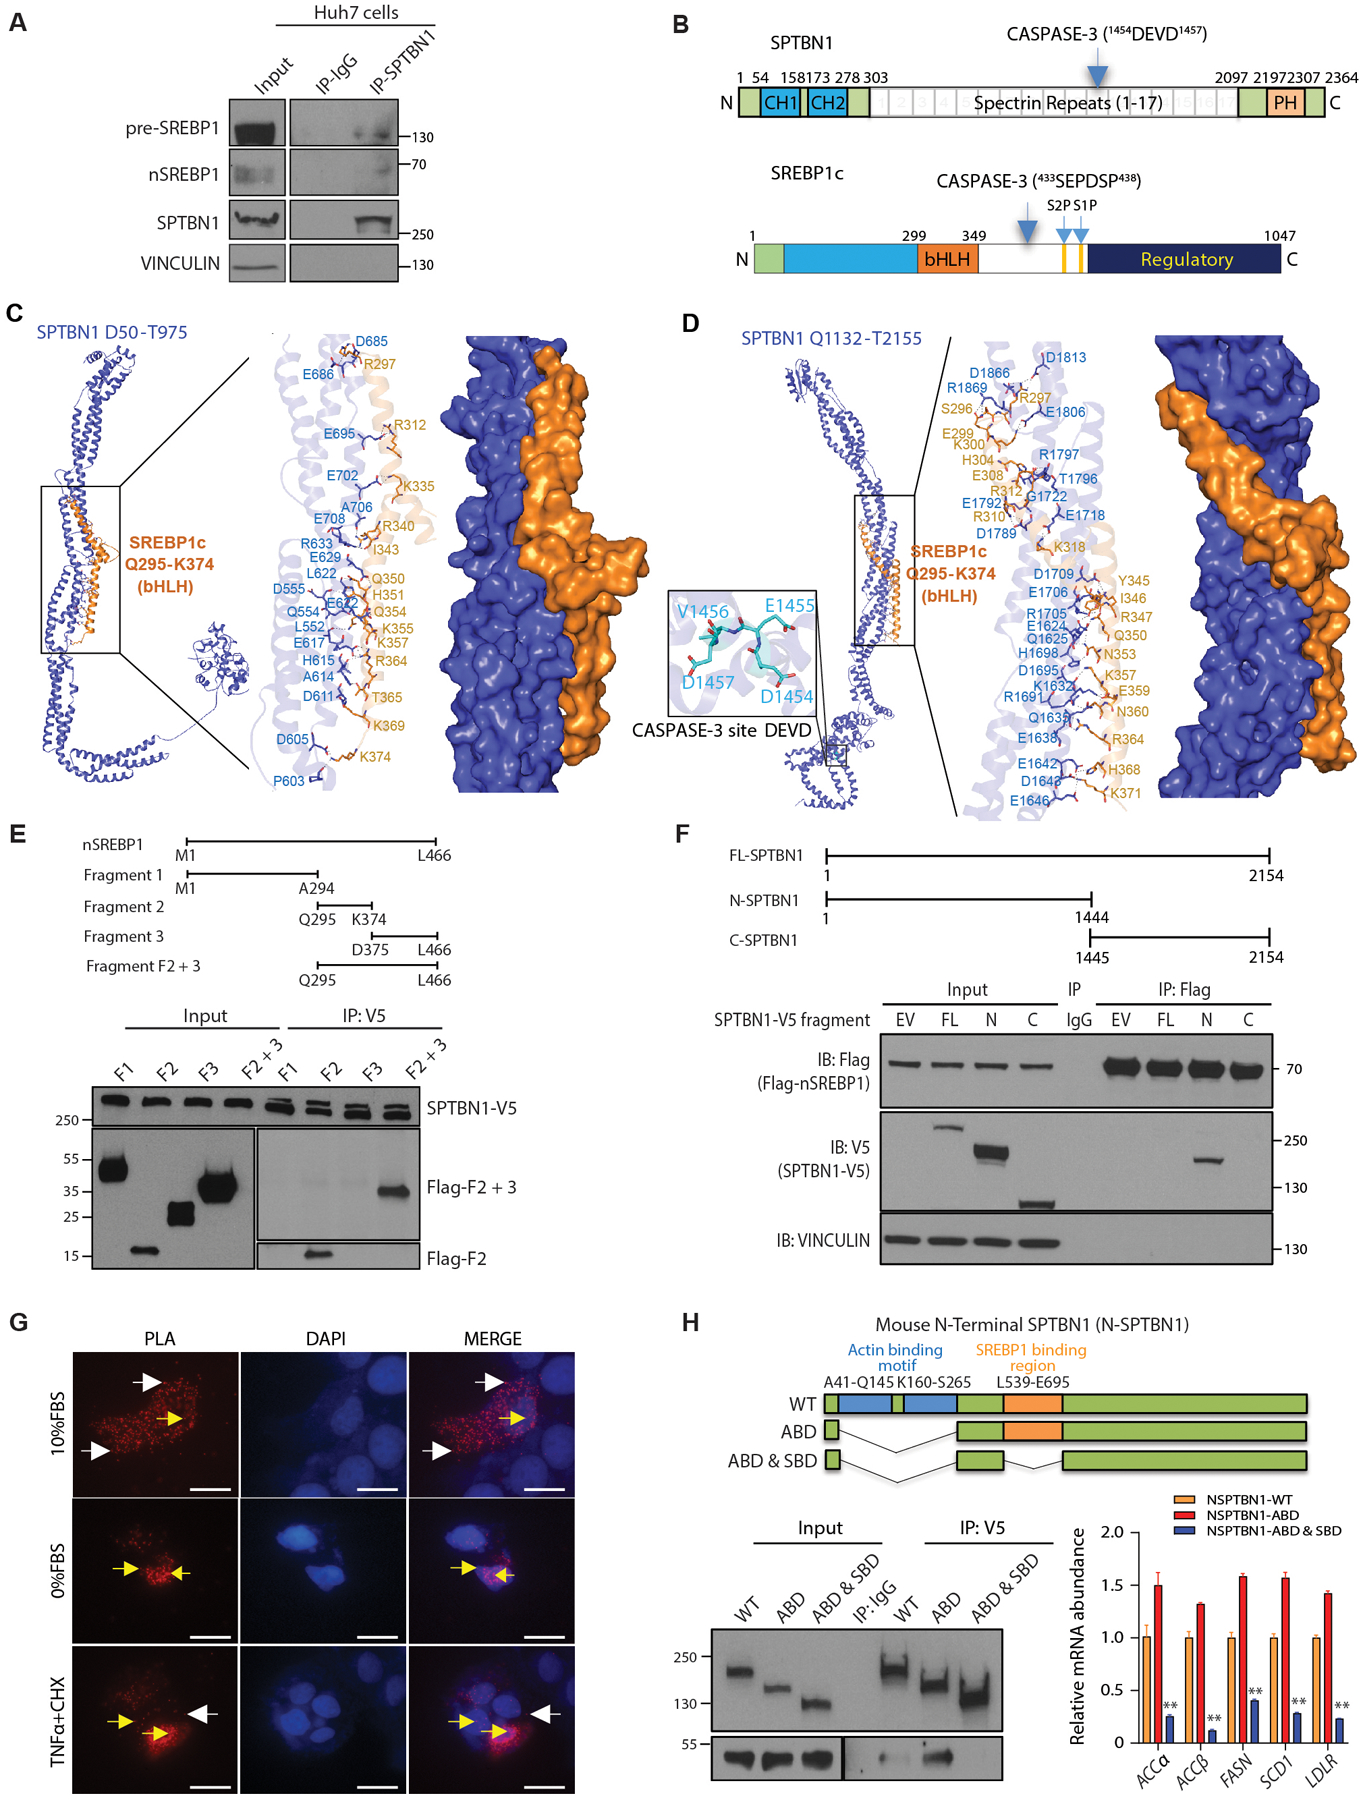
Fig. 3. SPBTN1 and SREBP1 interact.

(A) Coimmunoprecipitation of endogenous nSREBP1 and pre-SREBP1 with SPTBN1 from Huh7 cells. IgG served as a negative control for nonspecific binding. Space indicates input samples were analyzed separately because of the need for a shorter exposure. Data are representative of 1 of 3 experiments. IP, immunoprecipitation.
(B) Schematic of the domain organization of SPTBN1 and SREBP1c. CH, calponin homology; PH, pleckstrin homology; CASPASE-3 with cleavage site in parentheses; bHLH, basic helix loop helix; S1P and S2P, intramembrane cleavage sites.
(C) Structural model predicted by molecular docking simulations for the SPTBN1 fragment from amino acid residues D50 – T975 and SREBP1c amino acid residues Q295 – K374, encompassing the bHLH domain. Enlarged region shows predicted interacting residues.
(D) Structural model predicted by molecular docking simulations for the SPTBN1 fragment from amino acid residues Q1132 – T2155 and SREBP1c amino acid residues Q295 – K374, encompassing the bHLH domain. Enlarged region to the right shows predicted interacting residues; enlarged region to the left shows the CASPASE-3 cleavage site in SPTBN1.
(E) Coimmunoprecipitation of the indicated fragments of human nSREBP1 expressed as Flag-tagged peptides in Hep3B cells coexpressing full-length V5-tagged SPTBN1. Upper diagram shows the fragments (F1, fragment 1; F2, fragment 2; F3, fragment 3; F2 +3, fragment containing both parts of fragment 2 and fragment 3). Lower blot shows the input and immunoprecipitated (IP). The immunoprecipitation blot was exposed for longer than the input blot to enable visualization of low abundance fragments. Data are representative of 1 of 3 experiments.
(F) Coimmunoprecipitation of the indicated V5-tagged fragments of mouse SPTBN1 expressed with Flag-tagged peptides in SNU398 cells coexpressing Flag-tagged human nSREBP1. Upper diagram shows the fragments. Lower blot shows the input and immunoprecipitated (IP) proteins by Western blot. EV, empty vector for SPTBN1-V5; FL, full-length SPTBN1; N, N-terminal CASPASE-3 cleavage fragment of SPTBN1; C, C-terminal CASPASE-3-cleavage fragment of SPTBN1. VINCULIN and IgG served as negative controls. Data are representative of 1 of 3 experiments.
(G) Proximity ligation assay (PLA) to show the interaction between NSPTBN1-V5 with Flag-nSREBP1 in Huh7 cells in 10% FBS, 0%FBS, and in 10%FBS but treated with TNFα (20ng/ml) or cycloheximide (10mg/ml) for 3 hrs. Red fluorescent dots indicate NSPTBN1 and nSREBP1 are in close association in both cytoplasm (white arrows) and nucleus (yellow arrows). Scale bar = 20uM.
(H) Coimmunoprecipitation of the indicated V5-tagged fragments of mouse SPTBN1 with a deletion in SREBP1 binding region and/or actin-binding motif in Huh7 cells coexpressing Flag-tagged human nSREBP1 F2+3 fragment. Upper diagram shows the fragments. Lower left blot shows the input and immunoprecipitated (IP) proteins by Western blot, lower right shows the transcripts of SREBP1 target genes (n=3) in cells transfected with indicated N-STPBN1 deletion mutants. WT, wildtype; ABD, Actin binding domain; SDB, SREBP1 binding domain. Data shown as mean ± SEM are representative of 2 independent experiments performed in triplicate. Statistical significance was determined by one-way ANOVA Bonferroni’s multiple comparisons test between WT and mutant (**, p < 0.005).
