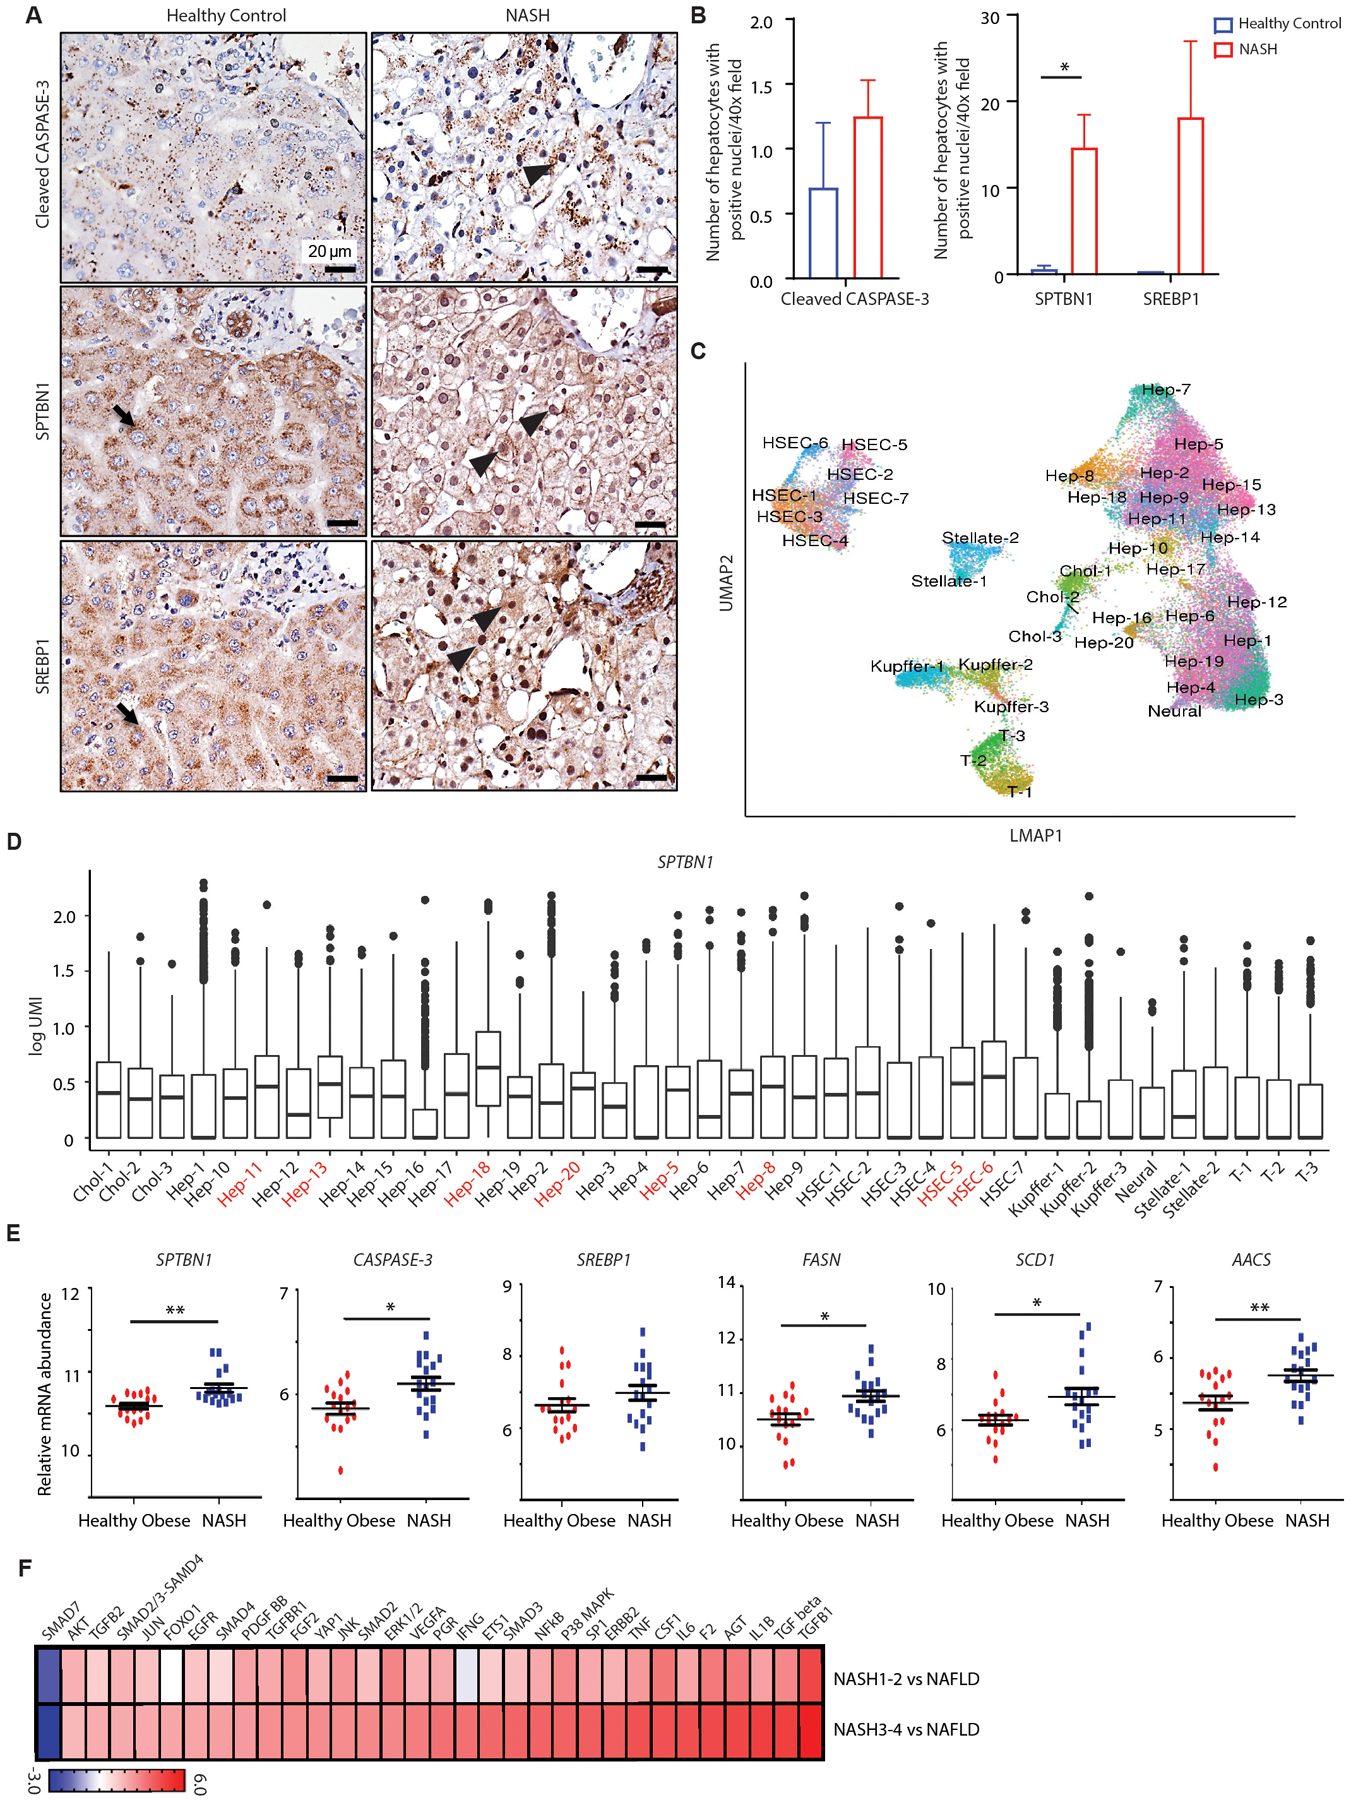
Fig. 5. SPTBN1 and CASPASE-3 expression and SREBP1 activity are increased in patients with NASH.

(A) Cleaved CASPASE-3, SPTBN1, and SREBP1 immunohistochemistry in liver tissues from normal healthy subjects and patients with NASH. Black arrow indicates cytoplasmic labeling and black arrowhead indicates nuclear labeling.
(B) Quantification of hepatocytes with positive nuclear labeling of cleaved CASPASE-3, SPTBN1, and SREBP1 in liver tissues from normal healthy individuals (n=2) and NASH patients (n=6 – 12). Average number of hepatocytes with positive nuclear labeling were counted under 40x field from 5 random fields of each sample. Data are shown as mean ± SEM. Significance was determined by 2-sided t-test (*, p < 0.05).
(C) Phenograph (UMAP) representation of the cells identified by single-nucleus sequencing.
(D) Analysis of SPTBN1 expression by single-nucleus sequencing of liver samples (n=6) from 3 patients with NASH mixed with HCC. Hep-1 through 20, hepatocyte subpopulations; HSEC, hepatic sinusoidal endothelial cells; Chol-1 to Chol-3, 3 populations of cholangiocytes; T-1 to T-3, 3 populations of T cells; Kupffer-1 to Kupffer-3, 3 populations of Kupffer cells (a type of macrophage); Stellate-1 to Stellate-2, 2 populations of hepatic stellate cells.
(E) Relative mRNA abundance of SPTBN1, CASPASE-3, SREBP1, and SREBP1 target genes in liver tissue samples from human healthy obese individuals (n=16) and NASH patients (n=17) from a public data set (GSE48452).
(F) Bioinformatic analysis by Ingenuity Pathway Analysis for Upstream Regulators of differentially regulated genes in livers from patients with stage 1 or 2 NASH (NASH1–2) or stage 3 or 4 NASH (NASH3–4) compared to patients with NAFLD. Gene expression was profiled by RNA-seq with differentially regulated genes determined by t-test. Regulators with activation (z score > 0) or inhibition (z score < 0) and p < 0.05 are shown.
