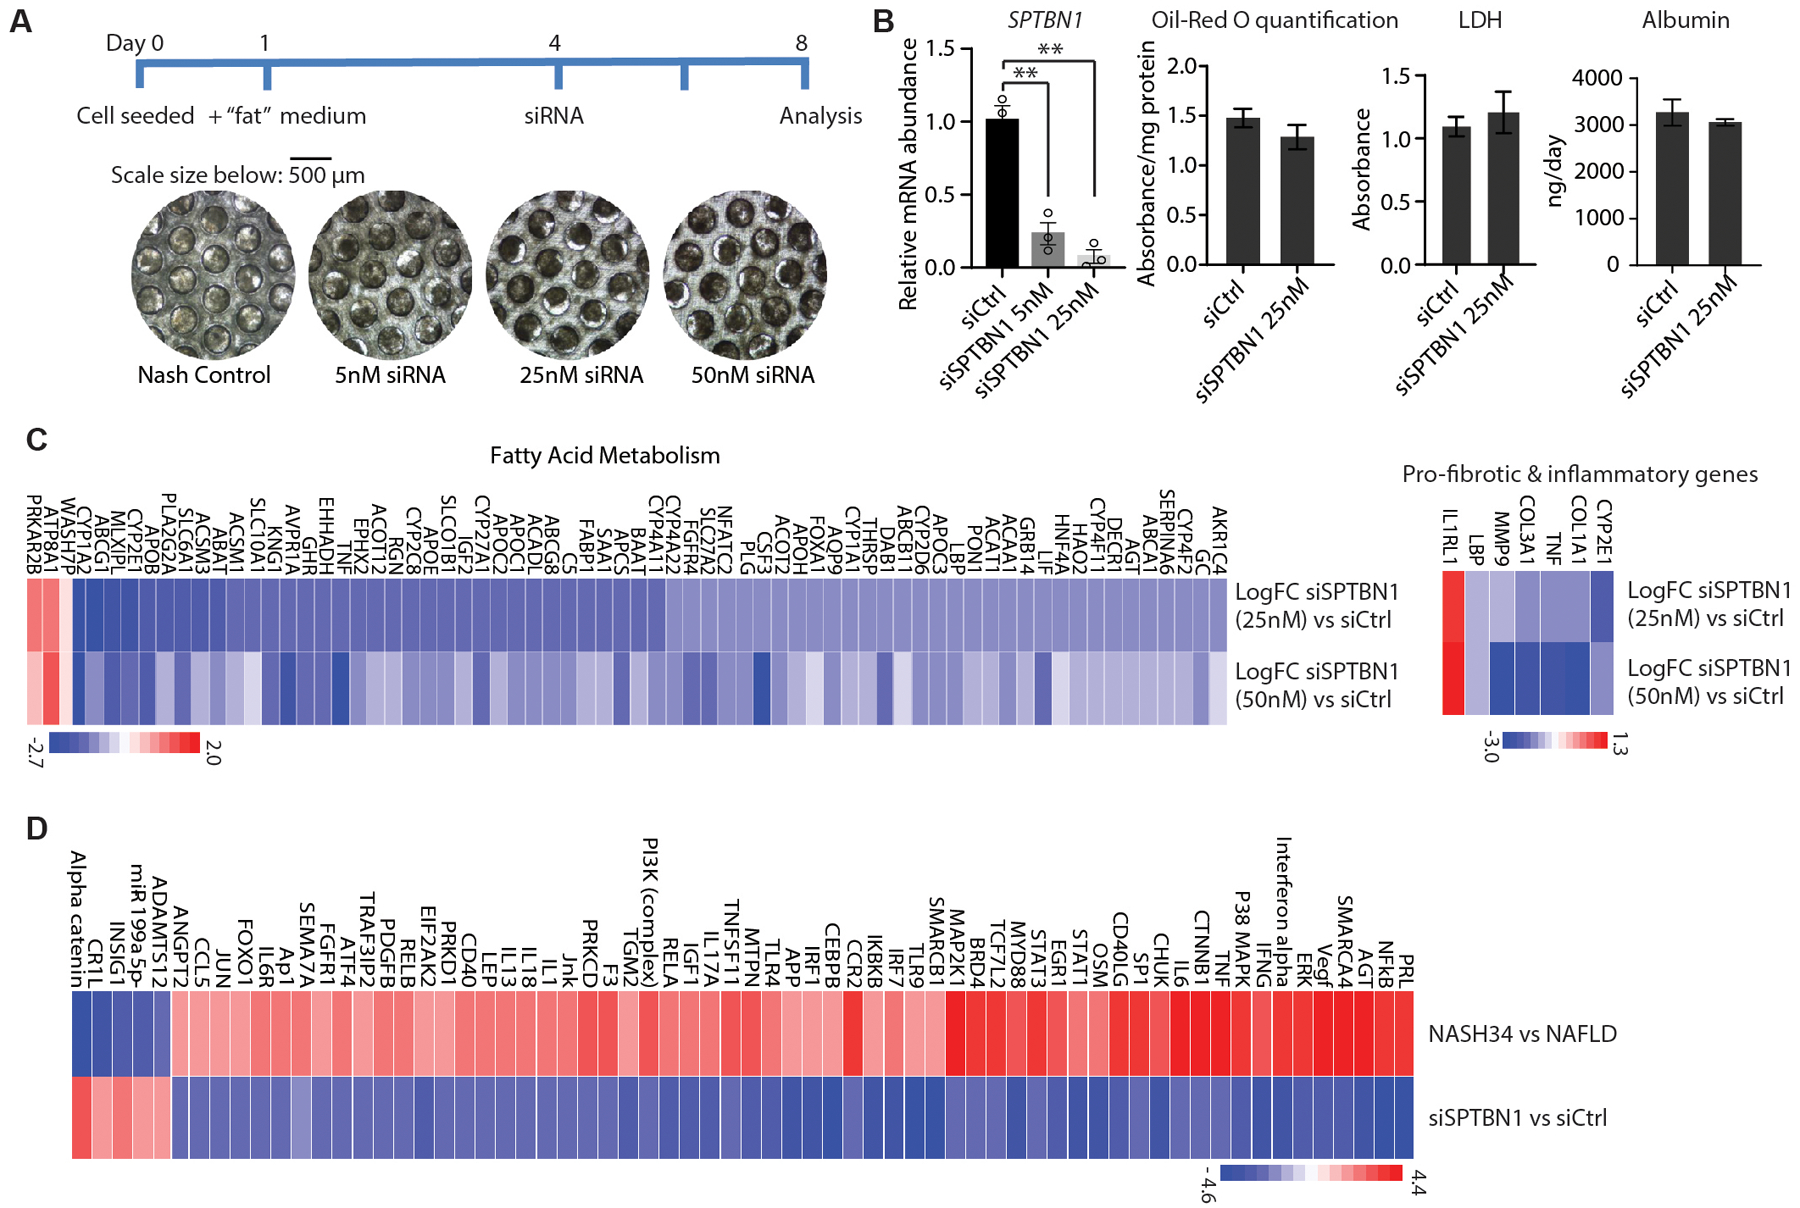
Figure 7. SPBTN1 siRNA reverses transcriptional changes associated with NASH in a human 3D culture model.

(A) Diagram and representative brightfield microscopy images of the cells scaffolds from 3D human NASH co-culture model system used to evaluate the effect of siSPTBN1 treatment.
(B) Left: Relative mRNA abundance of SPTBN1 in 3D human NASH co-culture model 96 h after the second addition of the indicated siRNAs. Middle: Quantification of Oil-Red O staining on day 8 in cultures treated with the indicated siRNAs. Right: LDH (lactate dehydrogenase) activity and albumin production in the medium of cultures treated with indicated siRNA (n=3).
(C) Heat map of changes in the expression of genes in fatty acid metabolism and genes associated with fibrosis and inflammation in the 3D culture treated with 25 nM siSPTBN1 or 50 nM siSPTBN1 compared to siCtrl. Cultures were collected 96 h after siRNA treatment and transcripts were evaluated by RNA-seq. Blue, downregulated; red, upregulated.
(D) Heat map of changes in upstream regulators significantly associated with differentially expressed genes in human NASH stages 3 and 4 compared with human NAFLD and the changes in these regulators in the 3D culture for siSPTBN1 compared to siCtrl. Cultures were collected 96 h after siRNA treatment and transcripts were evaluated by RNA-seq. Upstream regulator activity was determined with Ingenuity Pathway Analysis of “Upstream Regulators”.
Quantitative data are shown as mean ± SEM. Statistical significance was determined by 2-sided t-test for weekly changes in body weight and for all other quantitative data (*, p < 0.05; **, p < 0.005).
