


Fig. 8. LSKO mice develop fewer liver tumors.
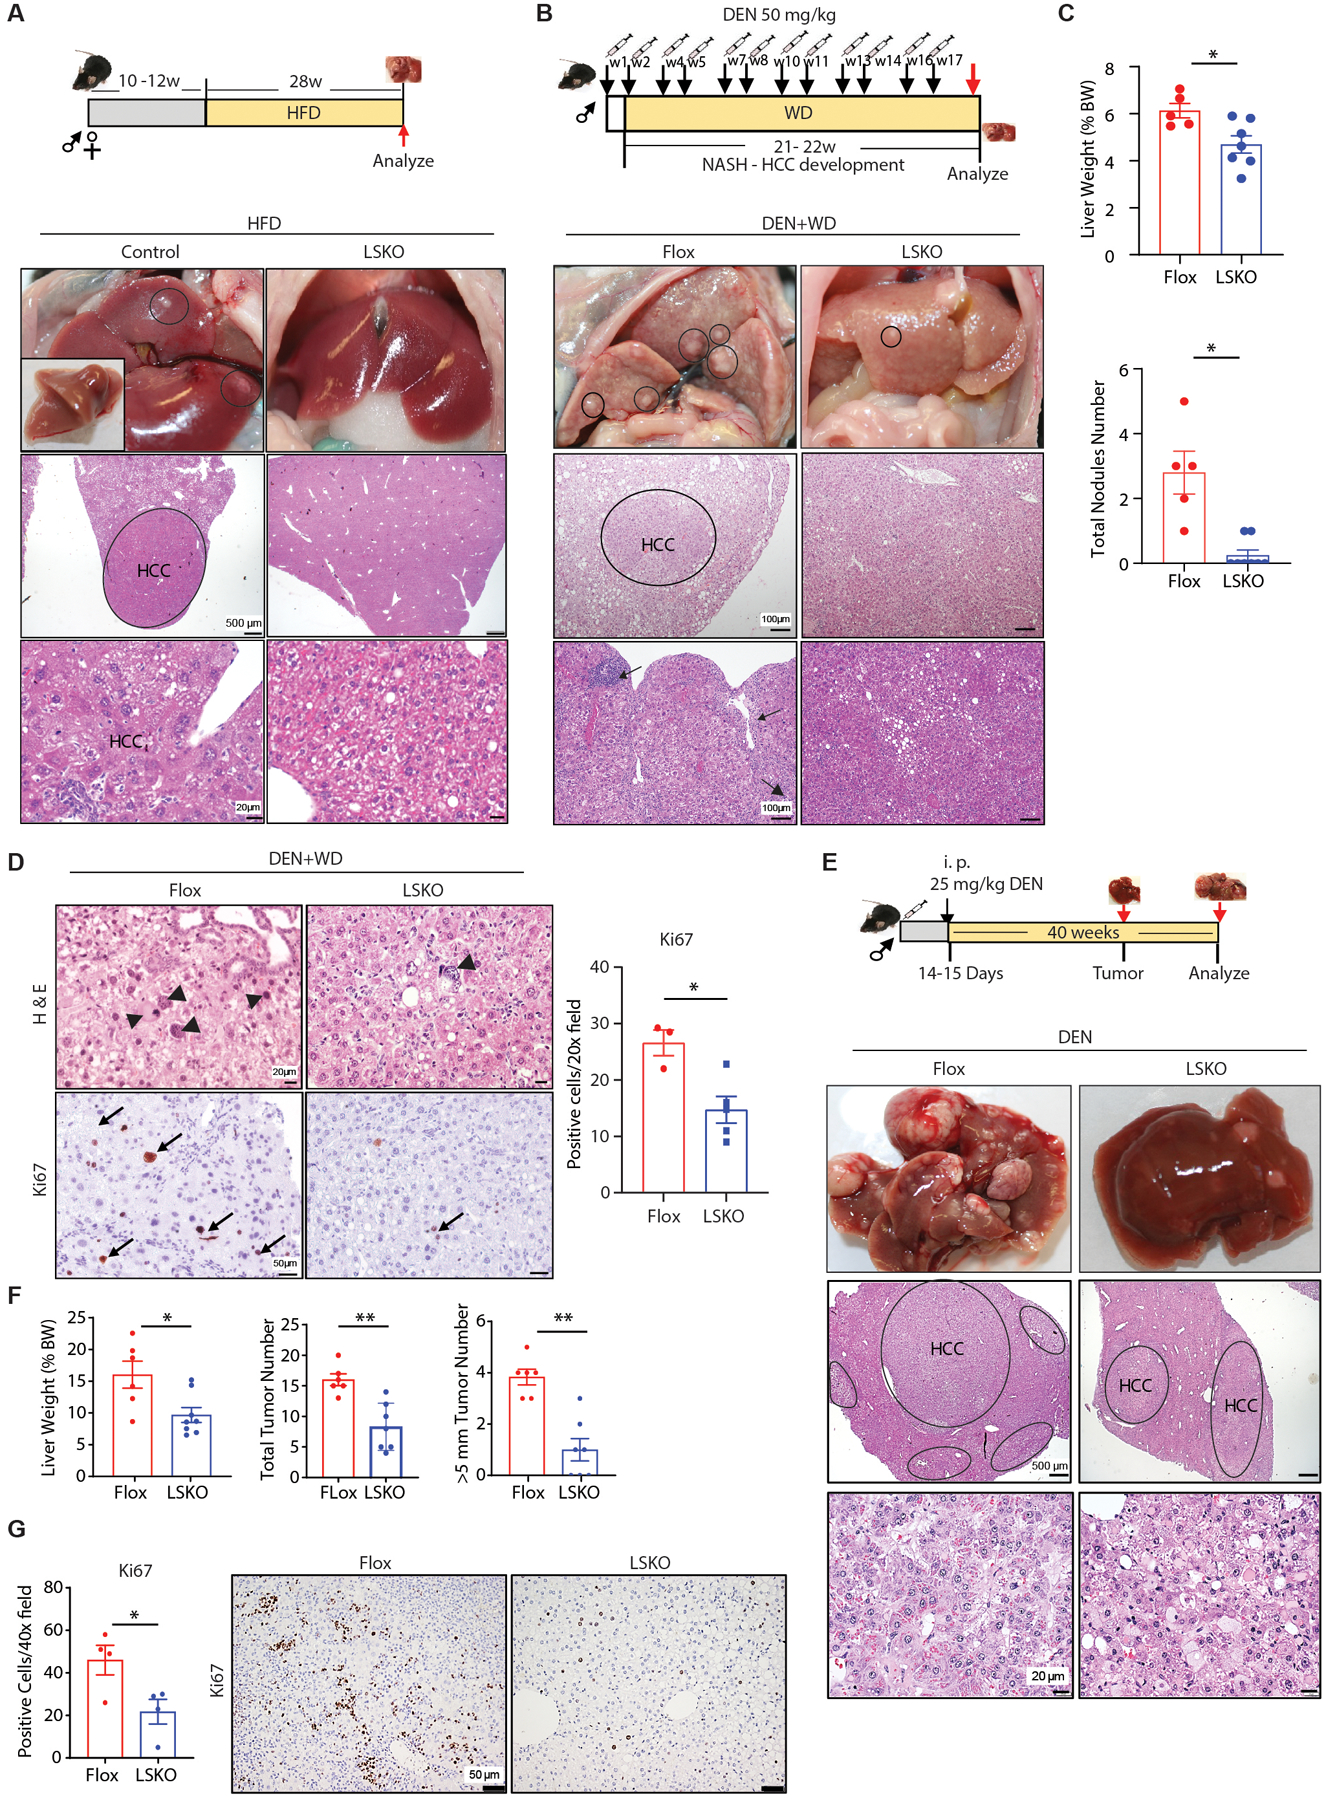
(A) Diagram of the experimental procedure of HFD-induced HCC (top). One of 4 control female control mice developed liver tumors after 28 weeks of HFD. Top: Gross morphology of the liver of that animal and morphology of the liver from an LSKO female littermate fed HFD for 28 weeks are shown. Inset shows excised liver. Circles show tumors. Middle and bottom: Liver histology by H & E staining. Tumor (HCC) is circled and bottom shows enlargement of tumor tissue.
(B) Diagram of the experimental procedure of chemical (DEN) plus WD-induced HCC (top). Gross morphology and H & E stained sections of livers in Flox or LSKO mice 22 weeks after DEN and WD. Inflammation (black arrows) sites are indicated.
(C) Top: Liver weight as percentage of body weight (BW) from Flox or LSKO mice 22 of weeks after DEN and WD (top). Bottom: Number of visible liver nodules observed in the liver tissues from Flox and LSKO mice. Flox, n=5; LSKO, n=7–8.
(D) Representative H & E stained sections and Ki67 immunohistochemistry and quantification of positive cells in liver sections from Flox and LSKO mice under 20X magnification. Arrowheads indicate abnormal hepatocytes with evidence of dysplasia Arrows indicate cells with positive staining of Ki67 staining. Flox, n=3; LSKO, n=5.
(E) Diagram of the experimental procedure of DEN-induced HCC (top). Gross pictures and H & E of liver tumors from Flox and LSKO mice 40 weeks after DEN injection. Upper: gross liver morphology. Middle: H & E stained sections with HCC tissue circled. Lower: H & E stained sections through tumor tissue circled.
(F) Liver weight as % of total body weight (BW), total number of tumors number, and number of tumors with a size > 5 mm in livers from Flox and LSKO mice at 40 weeks after DEN injection (n = 6 – 8).
(G) Representative Ki67 immunohistochemistry and quantification of positive cells in liver sections from Flox and LSKO mice under 20X magnification (n = 4 mice per group).
Quantitative data are shown as mean ± SEM. Statistical significance was determined by 2-sided t-test (*, p < 0.05; **, p < 0.005).