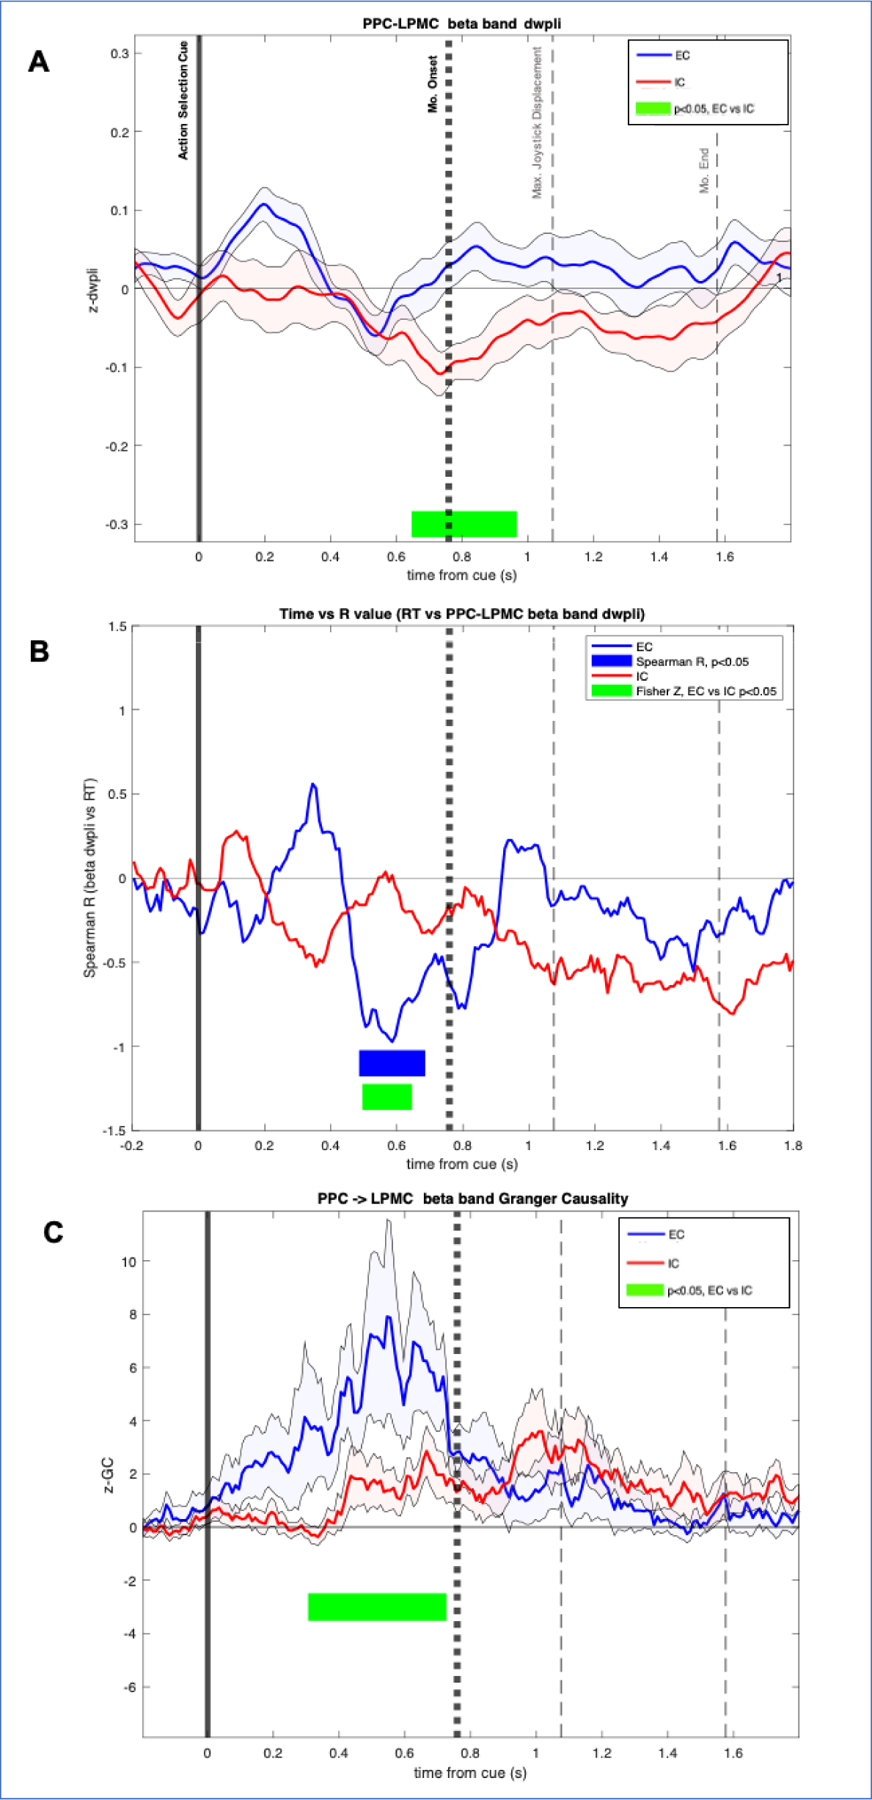
Figure 4.

A) Cue locked beta-band debiased weight phase lag index (dwPLI) between posterior parietal cortex (PPC) and lateral premotor cortex (LPMC). Significant differences were observed between externally cued (EC) and internally cued (IC) conditions, occurring around the time of movement onset, and sustained until peak joystick displacement. X-axis is time from cue. Y axis is z-dwPLI. Time periods with significant dwPLI differences between conditions are highlighted with green. Solid vertical line indicates timing of action selection cue. Bold dotted vertical line indicates group averaged movement onset, reaction time (RT). Gray dashed vertical lines indicate maximal joystick displacement and movement end. B) Spearman R values over time. Y axis is cross-subject spearman R value correlating beta-band PPC-LPMC dwPLI at each time point versus RT. Significant R values in the EC condition are highlighted in blue. No significant R values were observed in the IC condition. Significant differences in R values across EC and IC conditions are highlighted in green. C) Cue locked Beta-band Granger Causality (GC) in PPC and LPMC. Y-axis is z-GC. Significant differences between EC and IC conditions are highlighted in green. Max, maximum; Mo, movement; S, seconds.
