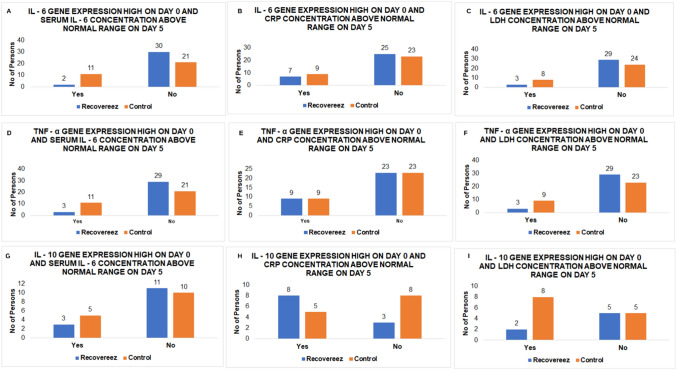
Fig. 1.
Gene expression of IFM on day 0 compared to protein levels of other inflammatory parameters assessed on day 5: a Number of subjects who showed high gene expression of IL-6 on day 0 and a correlation to the serum concentrations of IL-6 protein above normal range on day 5. b Number of subjects who showed high gene expression of IL-6 on day 0 and a correlation to the serum concentrations of CRP above normal range on day 5. c Number of subjects who showed high gene expression of IL-6 on day 0 and a correlation to the serum concentrations of LDH above normal range on day 5. d Number of subjects who showed high gene expression of TNF-α on day 0 and a correlation to the serum concentrations of IL-6 protein above normal range on day 5. e Number of subjects who showed high gene expression of TNF-α on day 0 and a correlation to the serum concentrations of CRP above normal range on day 5. f Number of subjects who showed high gene expression of TNF-α on day 0 and a correlation to the serum concentrations of LDH above normal range on day 5. g Number of subjects who showed high gene expression of IL-10 on day 0 and a correlation to the serum concentrations of IL-6 protein above normal range on day 5. h Number of subjects who showed high gene expression of IL-10 on day 0 and a correlation to the serum concentrations of CRP above normal range on day 5. i Number of subjects who showed high gene expression of IL-10 on day 0 and a correlation to the serum concentrations of LDH above normal range on day 5.

