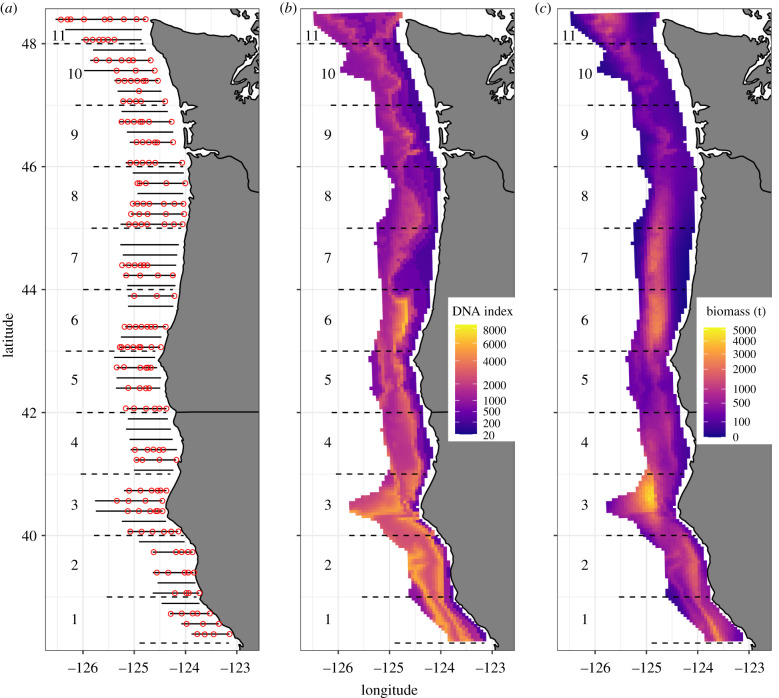
Figure 2.
Survey locations for 2019 ((a) circles show eDNA sampling locations, lines show acoustic transects), depth-integrated index of hake DNA (b) and hake biomass from acoustic surveys (c). Both DNA and acoustic estimates are mean predicted values projected to a 5 km grid and include information between 50 and 500 m deep. All panels show one degree latitudinal bins (numbered; separated by dashed lines) used to aggregate abundance estimates over larger spatial scales (figure 3). (Online version in colour.)

