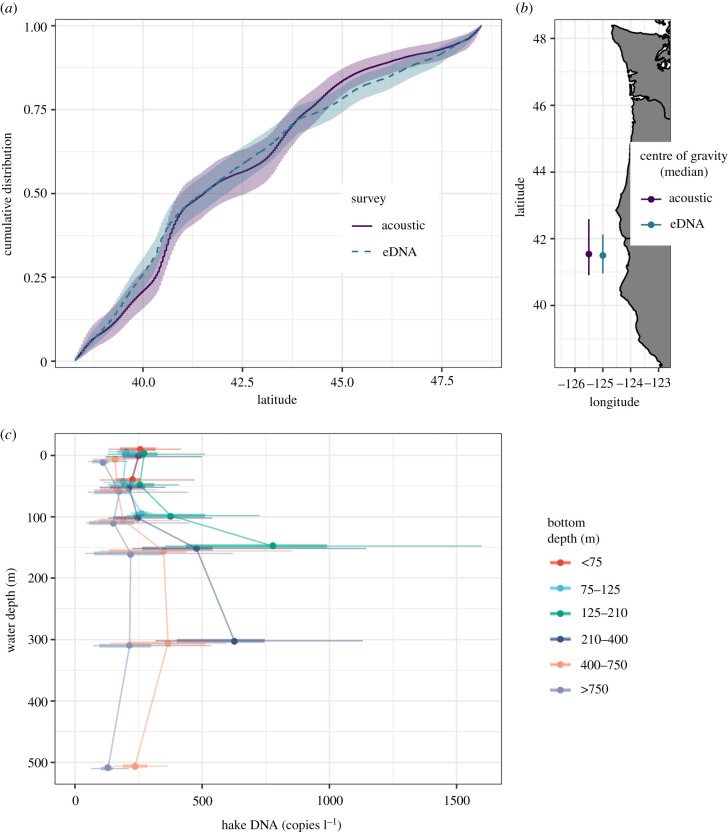
Figure 4.
Estimates of distribution of Pacific hake. (a) Cumulative distribution between 38.3 and 48.6°N (posterior means, 90% CI). (b) Centre of gravity (median of distribution) for each method (posterior means and 90% CI; only areas within the projection grid are included in this calculation; see figures 1 and 2). (c) Posterior estimates of hake DNA concentration at each station-depth combination by the water depth sampled and categories of the depth of the bottom. The distribution of mean DNA concentration among station-depths (mean, interquartile range and 90% CI among station-depths). Bottles at a sample location become increasingly similar at deeper sampling depths. (Online version in colour.)

