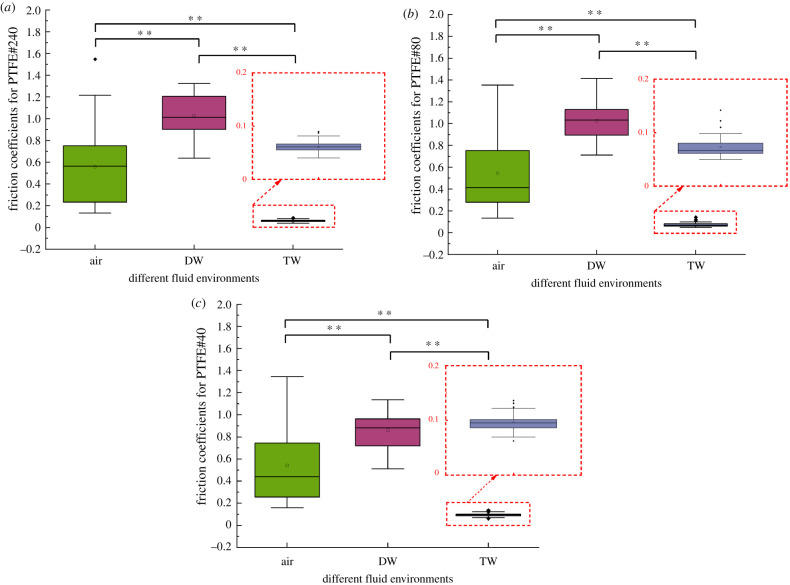
Figure 6.
Friction coefficients measured in different fluid environments for (a) PTFE#240, (b) #80, (c) #40. The ‘* *’ indicates a significant difference (p < 0.01) between two variables. The square marker indicates the average value, while the horizontal line indicates the sample median. The size of the box corresponds to the first and third quartiles. The error bar indicates the total range of values obtained, excluding any outliers. Outliers are marked as small black diamonds.

