Figure 2.
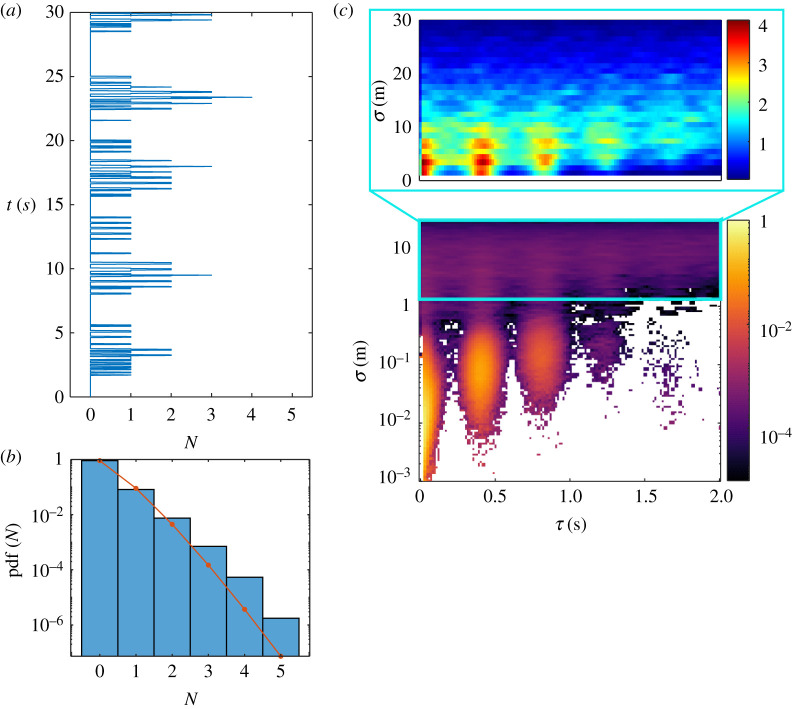
(a) Sample time series of the number N of flashes per frame. For visibility, only a short 30 s interval is shown. Many concurrent flashes happen during repeated bursts of activity. (b) Experimental probability distribution (pdf) of N from over 2 h of data (10 August). Red line is the result for a Poisson distribution with the same average λ as pdf (N). (c) Spatio-temporal correlations: distribution of separation σ and time delay τ between flash occurrences (150 min of data from 10 August). The bottom plot shows the full range of spatial separations, dominated by self-correlations at short range (σ < 1 m). The top plot shows the distribution only for σ > 1 m, emphasizing extrinsic correlations among distinct fireflies. The colour schemes indicate the relative frequency of different (τ, σ) domains.

