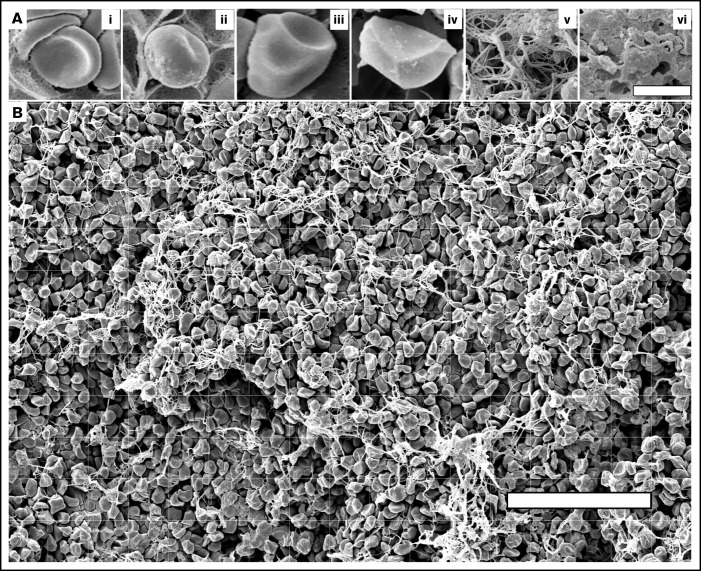
Figure 1.
Imaging and quantification of the structural elements of blood clots using high-resolution scanning electron microscopy. (A) Illustrating the structures analyzed in this study: nondeformed biconcave RBC (i), intermediate mainly biconcave RBC (ii), intermediate mainly polyhedral RBC (iii), fully compressed polyhedral RBC (polyhedrocyte) (iv), fibrin fibers (v), and sponge-like fibrin (vi). Bar represents 3.6 μm. (B) A scanning electron micrograph with overlaid grid used to quantify the composition of a blood clot. The structural elements were marked and measured individually. For RBCs, the number for each cell type was counted per image. For fibrin, the area occupied by fibrous and spongy fibrin structures within each grid square was estimated and expressed as percentage. The total area of each image taken at ×500 magnification was 154 μm × 238 μm = 36 652 μm2 (∼36 700 μm2). Scale bar represents 50 μm.

