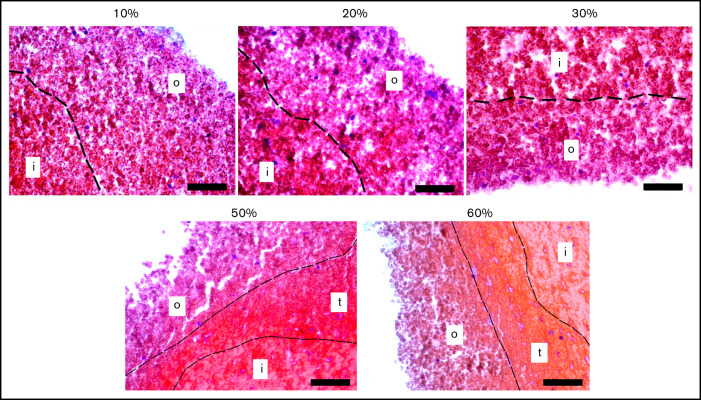
Figure 2.
Representative histological images of blood clots with varying extents of contraction. A border (dotted line) between the outer layer (o) and inner portion (i) of a clot is determined by the difference in the packing density of erythrocytes. Sometimes at the higher extents of contraction, a transition zone (t) with intermediate packing density was observed (hematoxylin and eosin stain; original magnification ×400). Scale bar represents 50 µm.

