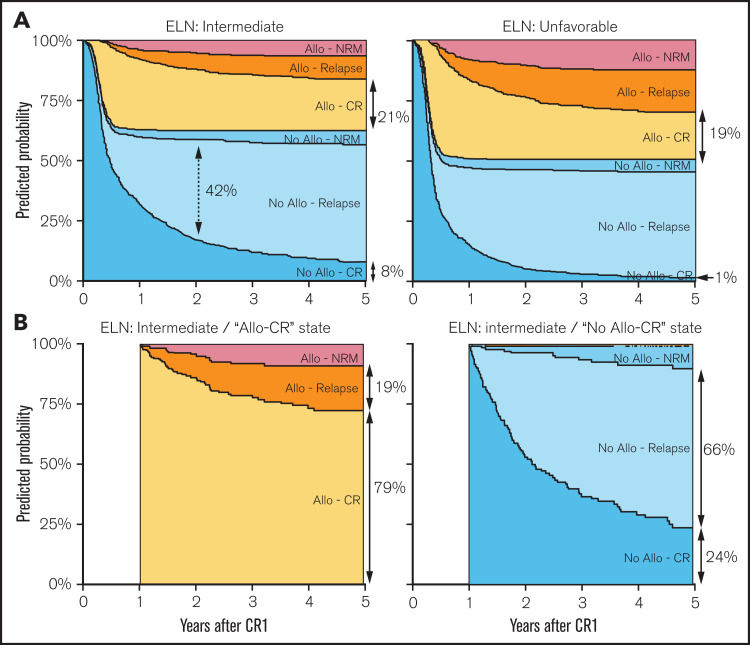
Figure 3.
Predicted probabilities from the multistate model. Predicted probabilities to be in a specific state (according to area and color) over time. (A) Evolution over 5 years of state probabilities from the time of CR1 (ie, 100% of patients in the “No allo-CR” state) for a representative patient with AML 65 years of age with intermediate (left panel) or unfavorable (right panel) ELN risk. The length of arrows represent the predicted probabilities at specific time points according to the x-axis (eg, the dotted double arrow shows a predicted probability of 42% for being in the “No allo-relapse” state 2 years after CR1 for a patient with intermediate ELN risk). Full double arrows show the predicted probabilities to be in the “allo-CR” or “No allo-CR” state at 5 years’ post-CR1. (B) Evolution of state probabilities from a 1-year post-CR1 landmark time to 5 years’ post-CR1, in a virtual representative patient with AML aged 65 years with intermediate ELN risk according to transplantation status at the landmark time (ie, from the “allo-CR” [left panel] and “No allo-CR” [right panel] states regardless of transplant, respectively). Full predicted probabilities at 2, 3, 4, and 5 years’ post-CR1 from landmark times of 0, 3, 6, 9, and 12 months’ post-CR1 are provided in supplemental Table 1.

