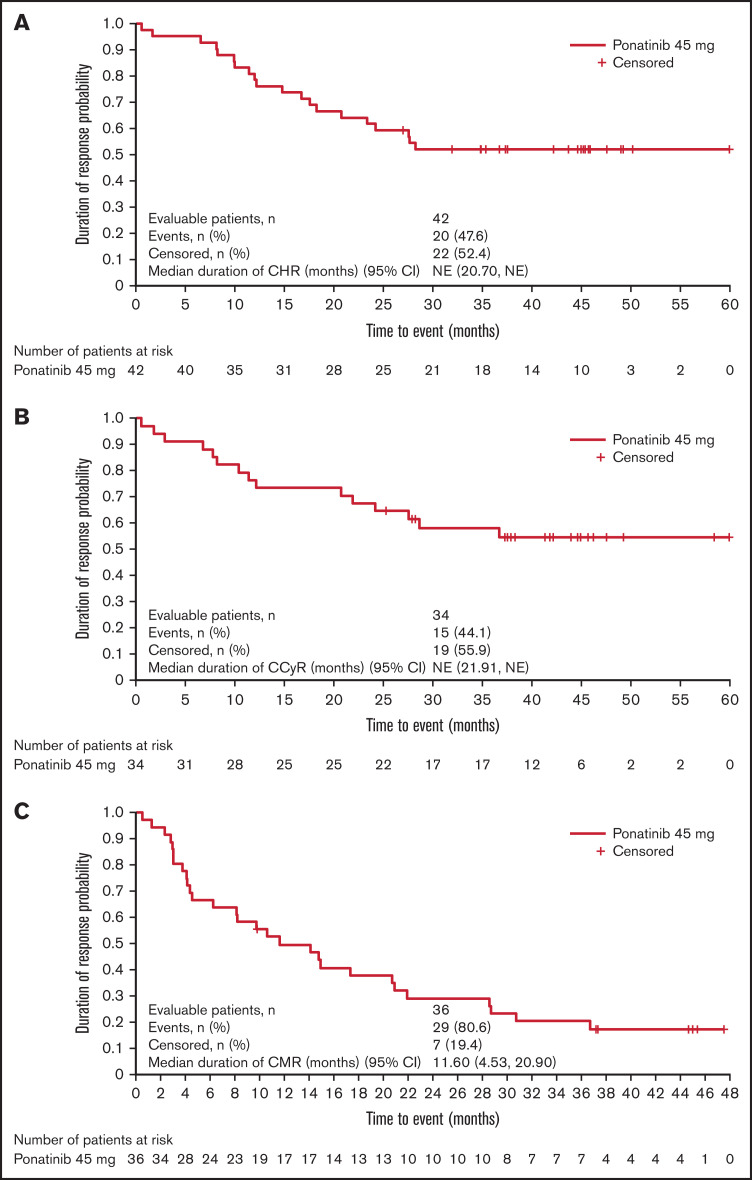
Figure 2.
Duration of response. Duration of CHR of patients who achieved CHR in the study, from diagnosis to death or loss of CHR (A); duration of CCyR of patients who achieved CCyR in the study, from diagnosis to death or loss of CCyR (B); and duration of CMR of the patients who achieved CMR in the study, from diagnosis to death or loss of CMR (C).

