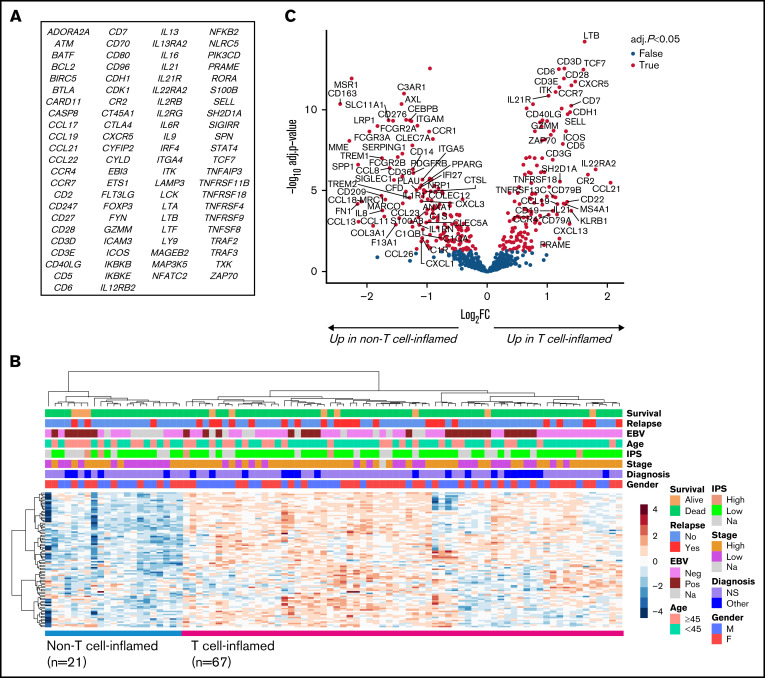
Figure 2.
T-cell signature divides the cHL TME into T cell-inflamed and -noninflamed groups. (A) List of 90 genes included in the T-cell signature. (B) Reclustering the T-cell signature genes separates patients into groups with T cell-inflamed (n = 67) and –noninflamed (n = 21) cHL TME. (C) Volcano plot showing differentially expressed genes between the samples with T cell-inflamed and -noninflamed TME. Named genes represent those with absolute log2 fold change ≥1 and adjusted P < .05.

