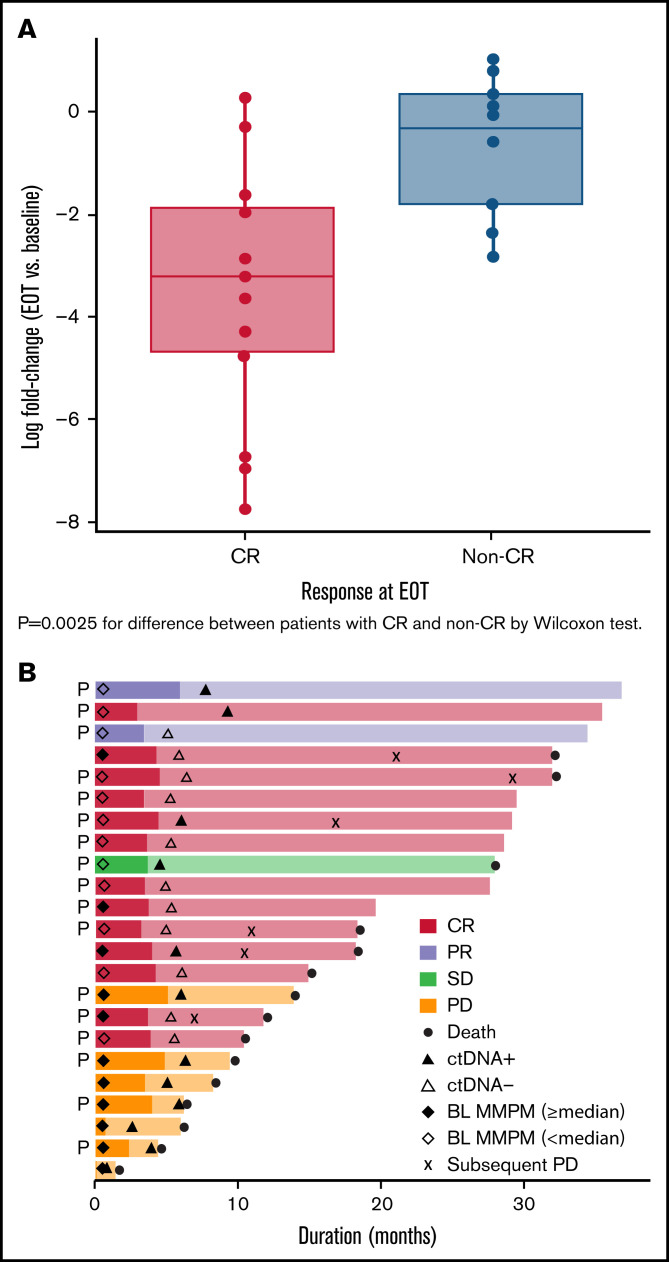
Figure 5.
Correlation between post-treatment ctDNA levels and patient response. (A) Log-fold change in ctDNA at EOT vs baseline in patients with or without a CR at EOT. (B) Swimlane plot of individual response to treatment showing patients with baseline ctDNA MMPM above and below the median and ctDNA clearance at EOT; P indicates patients who received polatuzumab vedotin. BL, baseline; PR, partial response; SD, stable disease.

