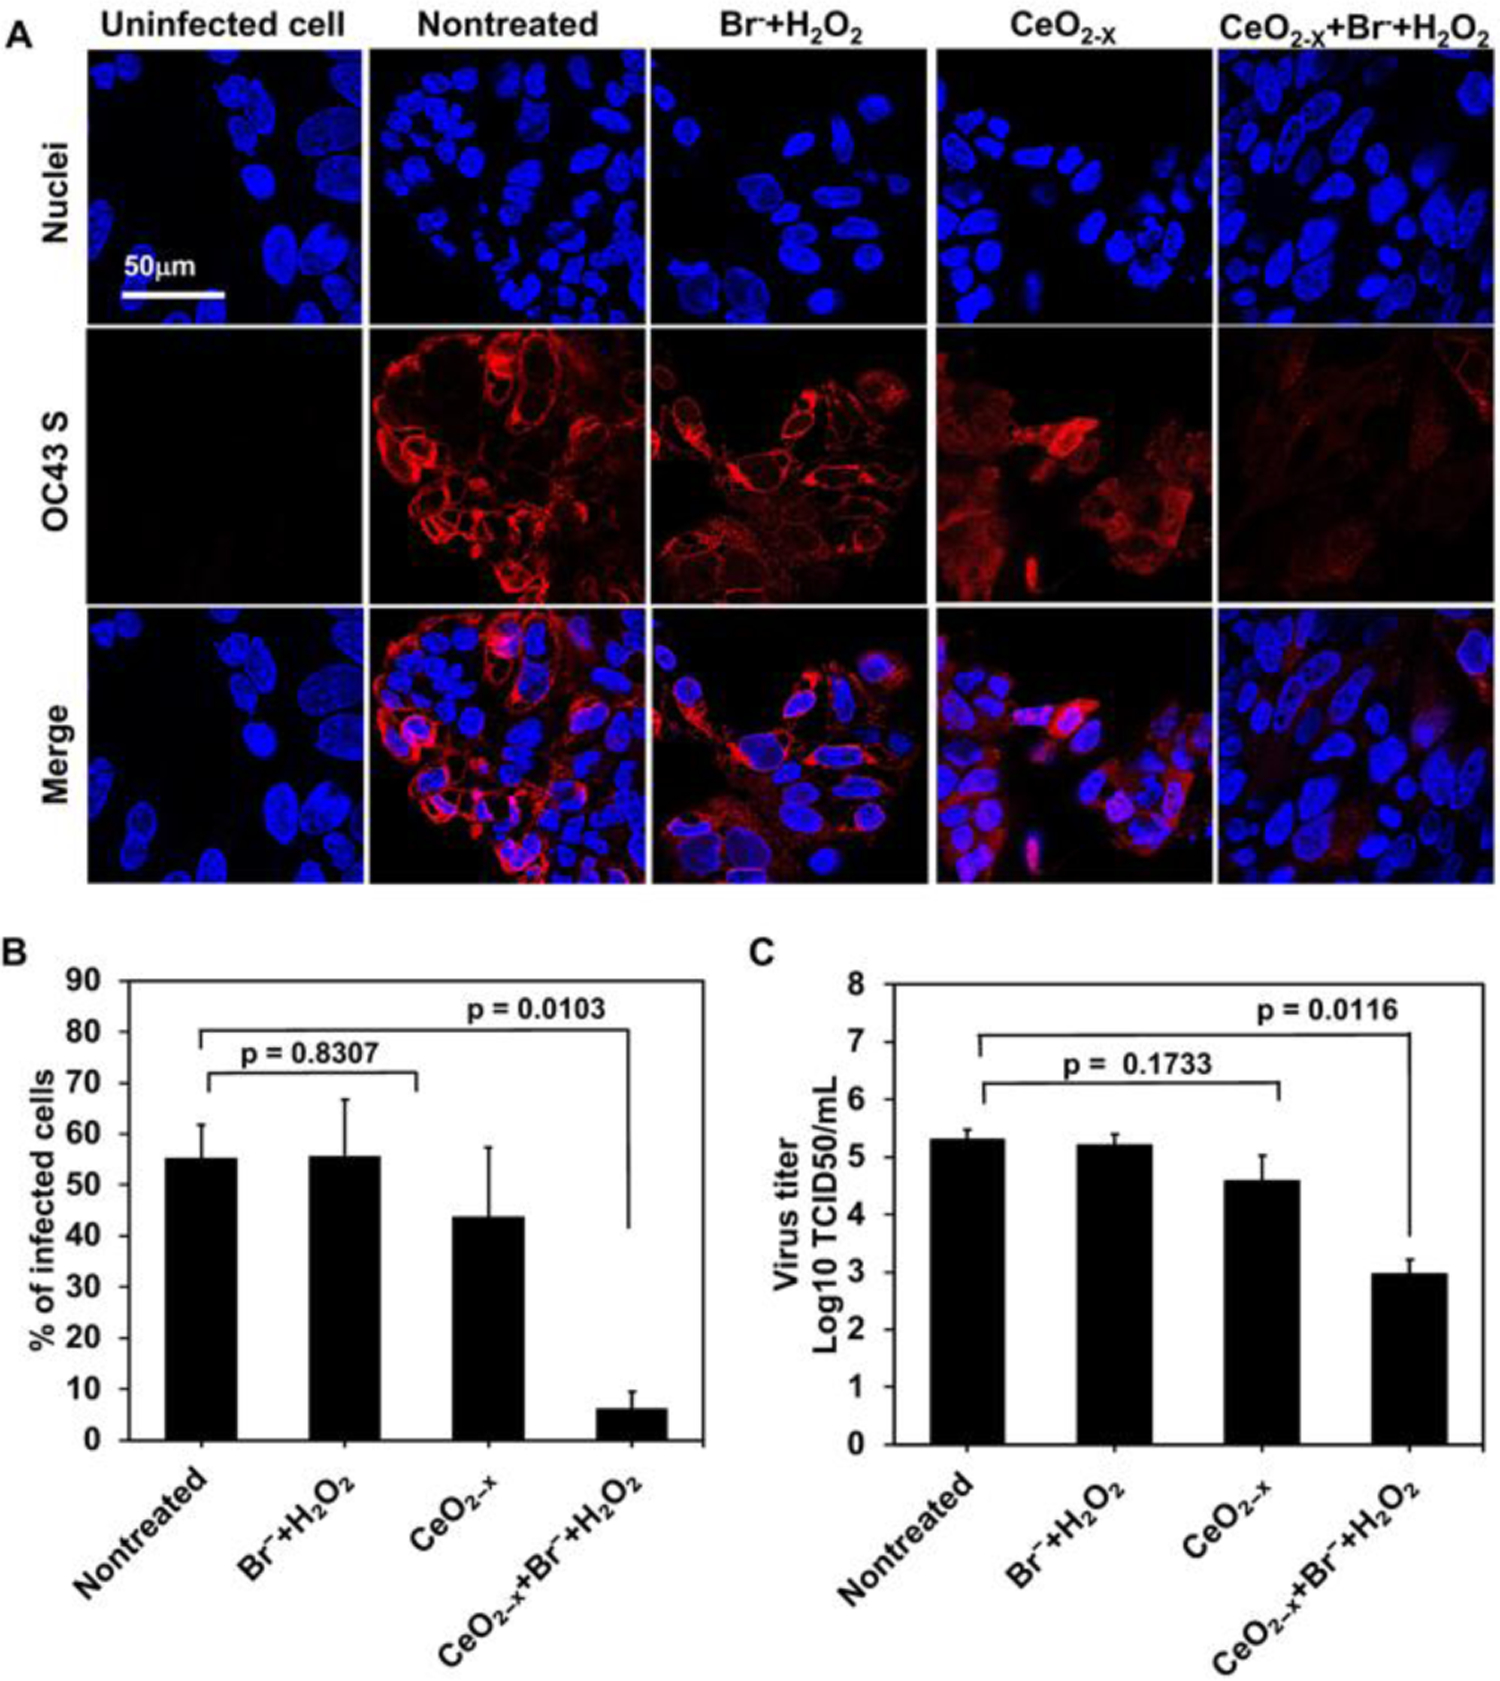
Fig. 5. Deactivation of coronavirus OC43 using the CeO2-x nanorods (with R=4.5).

(A) Immunofluorescence imaging of the HCT-8 cells infected by OC43 (with the MOI of 0.5) at 48 hours post infection. OC43 S indicates the spike protein of OC43 (red); nuclei of the HCT-8 cells were stained by Hoechst 33258 (blue). (B) The amount of infected cells, i.e., OC43 S-positive cells, quantified using the immunofluorescence images. Data are mean ± SD (n = 5). (C) Reduction of the virus titer by the formulation containing 0.04 mg/mL CeO2-x, 1 mM Br−, and 10 μM H2O2, quantified by the TCID50 assay with the tissue culture infection dose of 50%. Data are mean ± SD (n = 3).
