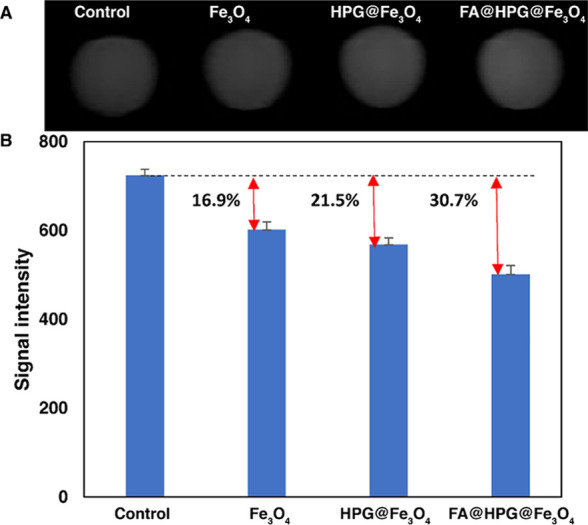
Figure 9.

(A) T2-weighted MRI phantom images of HeLa cells after incubation with nanocarriers at a concentration of 0.2 mg/mL (a, left) FA@HPG@Fe3O4 (25% w: w FA:polymer), (b) HPG@Fe3O4, (c) control sample, (d, right) Fe3O4 nanoparticles. (B) Signal intensity and increase in in vitro T2-weighted MRI.
