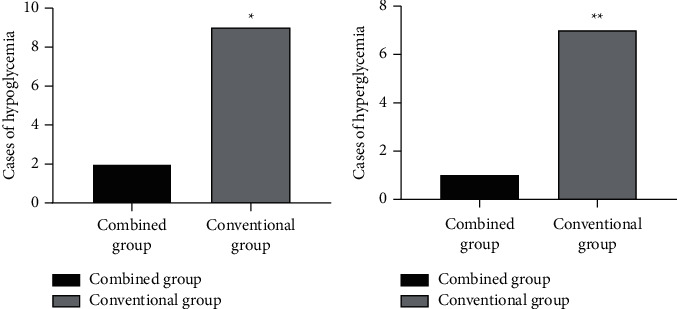
Figure 1.

Comparison of incidence of hypoglycemia and hyperglycemia [n (%)]. (a) The comparison of incidence of hypoglycemia between the two groups after intervention. The abscissa indicates the combined group and the conventional group, and the ordinate indicates cases of hypoglycemia. The incidence of hypoglycemia in the combined group and the conventional group after intervention was 2 cases (4.44%) and 9 cases (20.00%), respectively. ∗indicates the obvious difference in incidence of hypoglycemia between the two groups after intervention (X2 = 5.075, P < 0.05). (b) The comparison of incidence of hyperglycemia between the two groups after intervention. The abscissa indicates the combined group and the conventional group, and the ordinate indicates cases of hyperglycemia. The incidence of hyperglycemia in the combined group and the conventional group after intervention was 1 case (2.22%) and 7 cases (16.67%), respectively. ∗∗indicates the obvious difference in incidence of hyperglycemia between the two groups after intervention (X2 = 4.939, P < 0.05).
