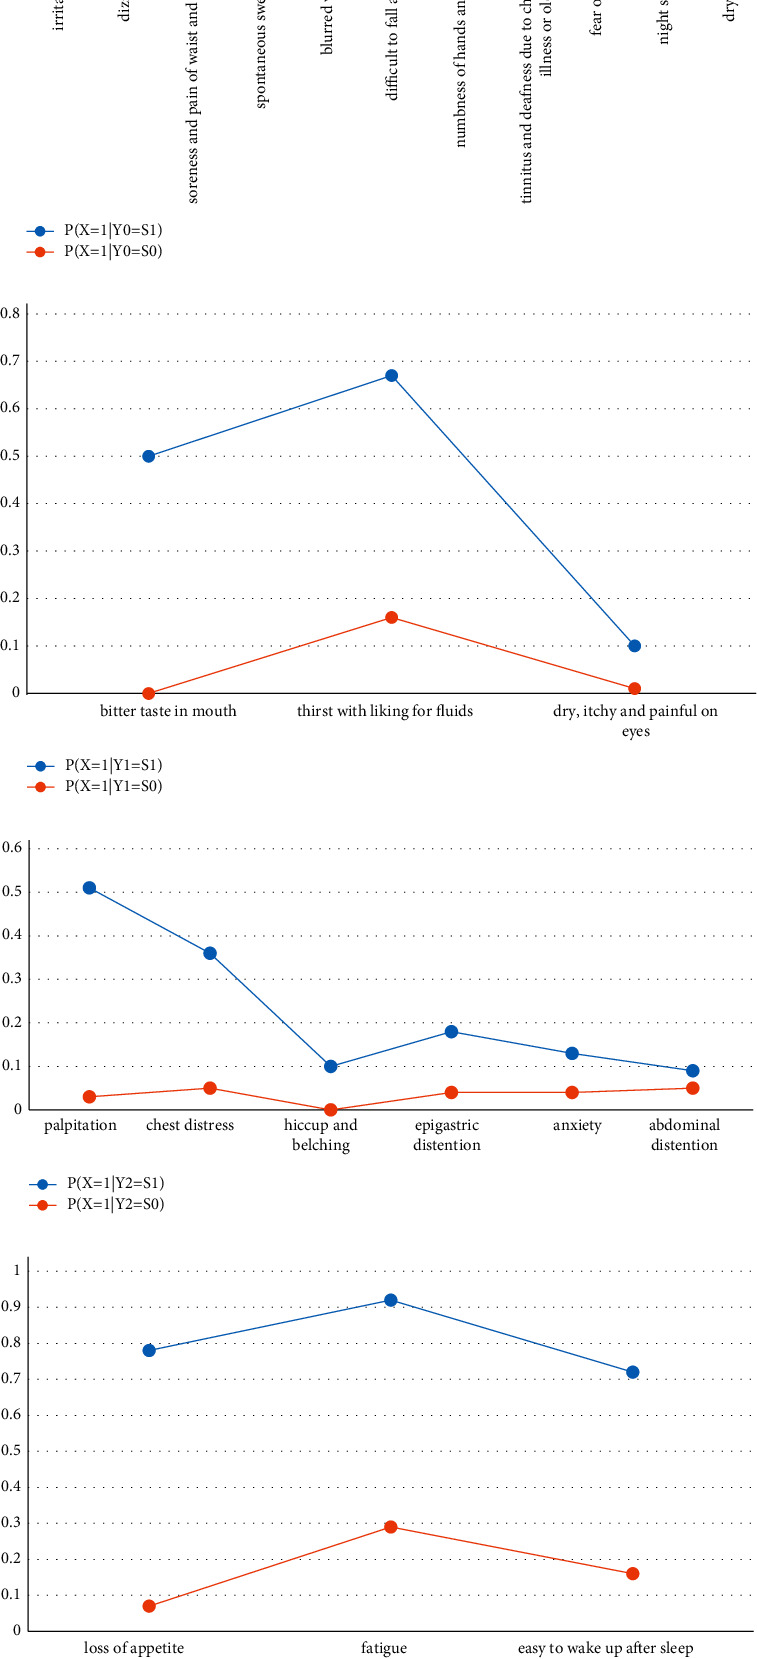
Figure 4.

Line charts of conditional probability distributions. (a) Line charts of conditional probability distributions of two latent classes Y0 = S1 and Y0 = S0 of latent variable Y0. (b) Line charts of conditional probability distributions of two latent classes Y1 = S1 and Y1 = S0 of latent variable Y1. (c) Line charts of conditional probability distributions of two latent classes Y2 = S1 and Y2 = S0 of latent variable Y2. (d) Line charts of conditional probability distributions of two latent classes Y3 = S1 and Y3 = S0 of latent variable Y3.
