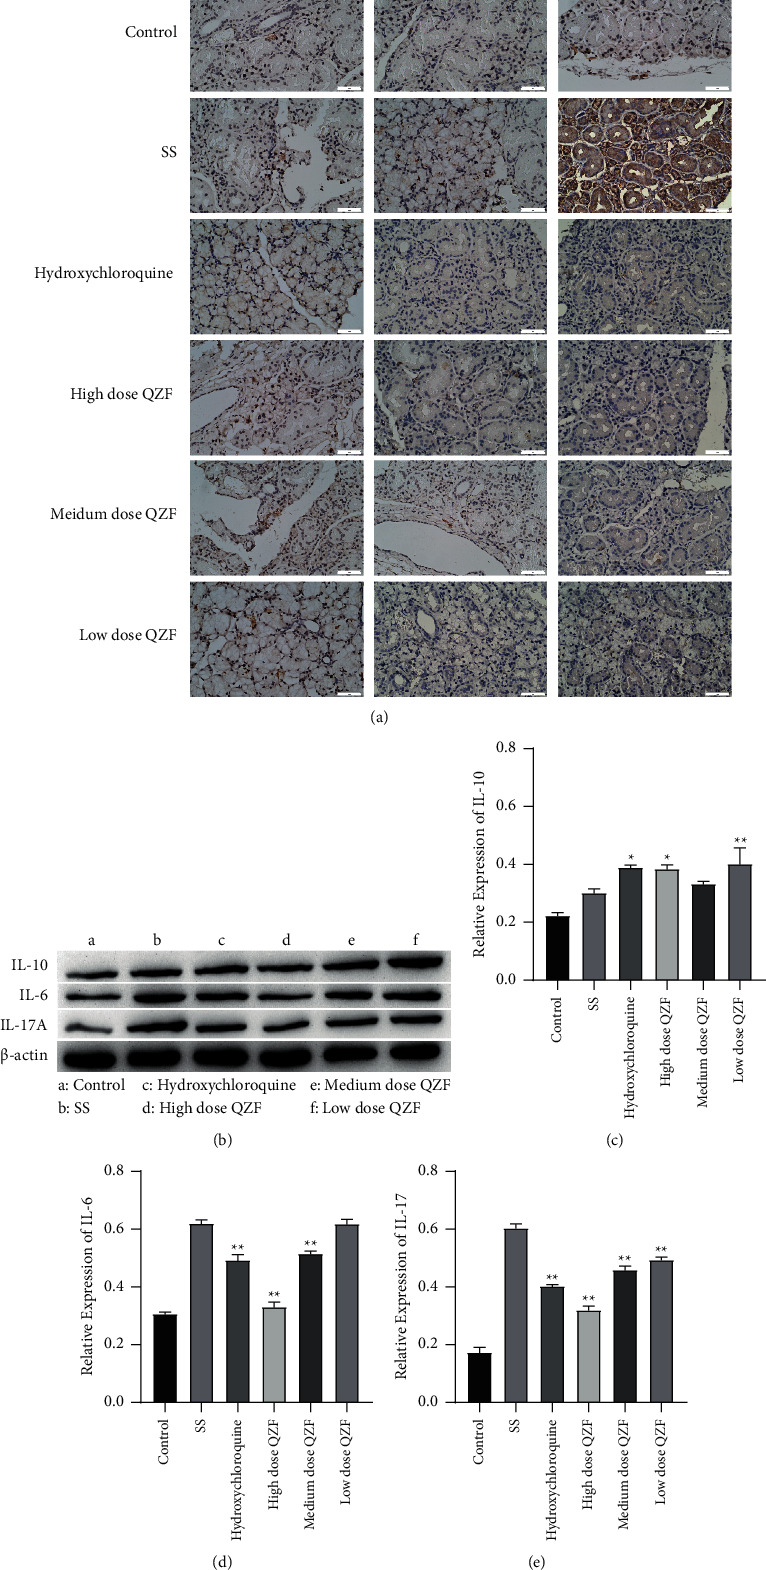
Figure 4.

Effect of QZF on IL-6, IL-10, and IL-17A levels in submandibular gland tissue. (a) Representative immunohistochemical staining micrographs for IL-6, IL-10, and IL-17A; Bar = 50 μm. (b) Western blot detection of the protein expressions of IL-6, IL-10, and IL-17A, and (c)–(e) shown as diagram with statistical analysis. Comparisons among multiple groups were made with ANOVA followed by Tukey's post hoc test. ∗p < 0.05, ∗∗p < 0.01; compared to the SS mice model group.
