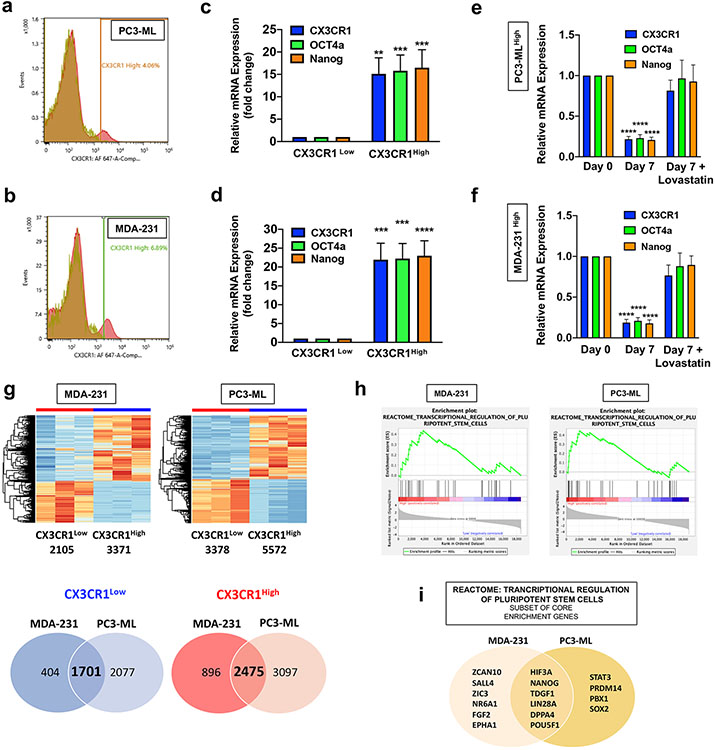
Figure 3.
Sub-populations of CX3CR1High cancer cells demonstrate stemness features. Univariate histograms, obtained by flow cytometry with parental populations of PC3-ML (a) and MDA-231 (b) cells with antibodies specific for human CX3CR1, identify small contingents of cells staining for the chemokine receptor (MDA-231 cells 5±0.5% [18n] and PC3-ML 3.7±0.3% [32n]), clearly separated from the majority of each cell population that lacks CX3CR1 expression. Sorting pure CX3CR1Low and CX3CR1High sub-populations by FACS for transcript analysis demonstrated a significant up-regulation of CX3CR1, OCT4a, and NANOG in both PC3-ML (c) and MDA-231 (d) cells. CX3CR1High cells isolated from the parental PC3-ML (e) and MDA-231 (f) cells were placed in culture for 7 days with or without 10μM lovastatin. The transcript levels were quantified at day 7 for untreated and lovastatin treated cells and compared to the levels measured immediately after sorting (day 0). Lovastatin treatment prevented the reduction in CX3CR1, OCT4a, and NANOG transcript levels after 7 days in culture observed in untreated cells, resulting in retention of the CX3CR1High phenotype. g. RNA-seq was performed for whole transcriptome analysis of the CX3CR1Low and CX3CR1High sub-populations sorted from the MDA-231 and PC3-ML parental cell lines. Differentially expressed genes are represented by a heatmap for each cell line. The number of commonly upregulated and downregulated differentially expressed genes between the MDA-231 and PC3-ML cells are represented by Venn diagrams. h. GSEA was performed against Reactome canonical pathways and both MDA-231 and PC3-ML CX3CR1High sub-populations were enriched with the transcriptional regulation of pluripotent stem cells signature. i. The subset of core enrichment genes for both MDA-231 and PC3-ML cells contributing to the transcriptional regulation of pluripotent stem cells signature of the Reactome database. The Venn diagram shows the core enrichment genes expressed in common by CX3CR1High cells sorted from MDA-231 and PC3-ML cell lines. (c: **P=0.0016; ***P=0.0009 (OCT4a); ***P=0.0007 (NANOG); Nine biological replicates; d: ***P=0.0002 (CX3CR1); ***P=0.0001 (OCT4a); ****P<0.0001; n=5; e and f: ****P<0.0001; g: Differentially expressed genes are defined by an adjusted p-value of ≤ 0.05 and absolute fold change of ≥ 2; H: FDR q-value=0.0395 and NES=1.4664 (MDA-MB-231); FDR q-value=0.0193 and NES=1.5932 (PC3-ML). One-way ANOVA.

