
Figure 5. Cuprizone selectively inhibits H2O2 release and mitochondrial oxidative stress in FaDu cells.
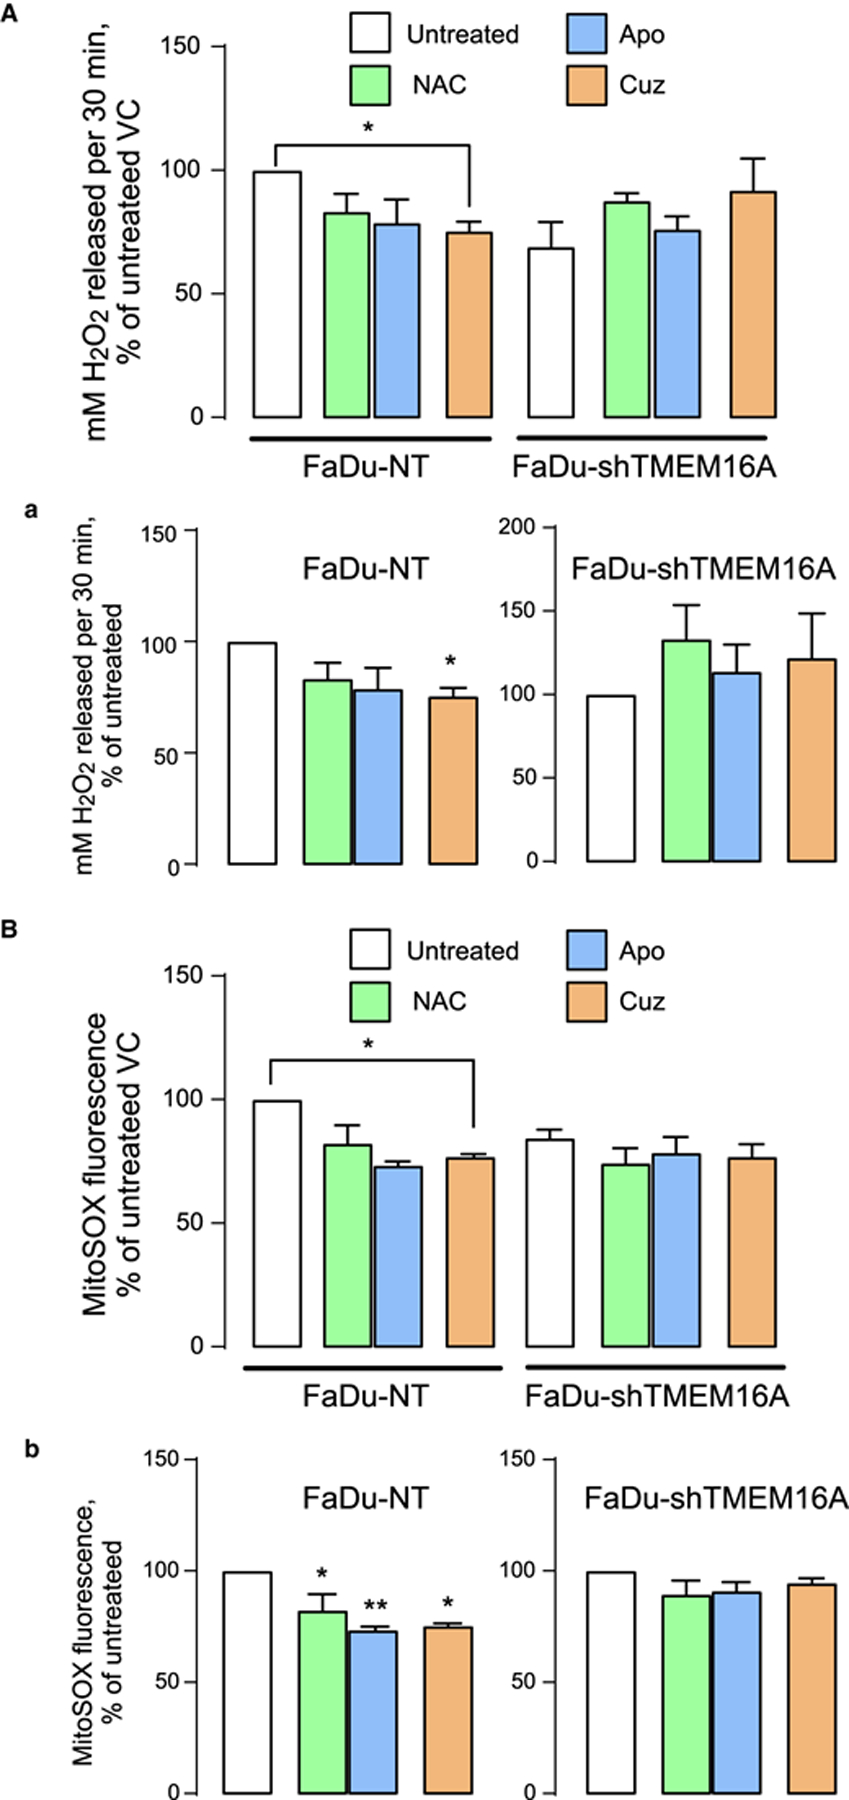
(A) Amplex Red is measured in FaDu-NT and FaDu-shTMEM16A cells. H2O2 released is represented as % change of untreated NT (a, left panel) or % change of untreated shTMEM16A (a, right panel). (B) MitoSOX is measured in FaDu-NT and FaDu-shTMEM16A cells. MitoSOX fluorescence is shown as % change of untreated NT (b, left panel) and as % change of untreated shTMEM16A (b, right panel). Significance is shown at * P < 0.05 and ** P < 0.001 when compared with untreated control by one-way ANOVA with Dunnet’s adjustment.