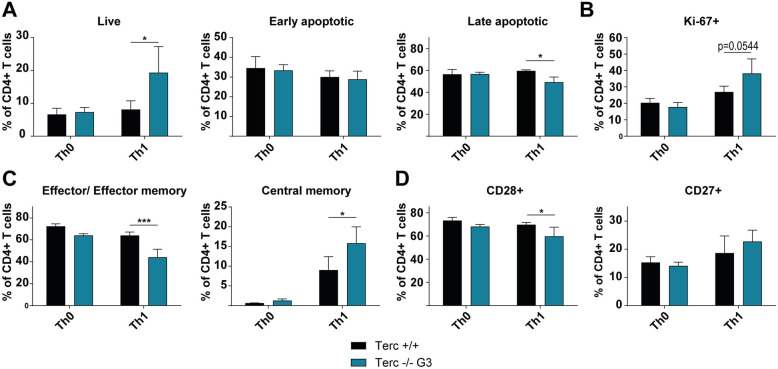
Fig. 3.
mTerc−/− CD4+ T cells show functional differences after in vitro polarization. A and (B Flow cytometric quantification of proliferating (Ki-67+), live (Annexin V- PI-), early apoptotic (Annexin V+ PI-) and late apoptotic (Annexin V+ PI+) cells. C Functional analysis of memory populations (central memory: CD44+ CD62L+; effector/ effector memory: CD44+ CD62L-) after in vitro polarization measured by flow cytometry. D Expression of costimulatory molecules CD28 and CD27 among in vitro polarized CD4+ T cells as determined by flow cytometry. All graphs show the mean ± SD, * adjusted p ≤ 0.05, ** adjusted p ≤ 0.01, *** adjusted p ≤ 0.001

