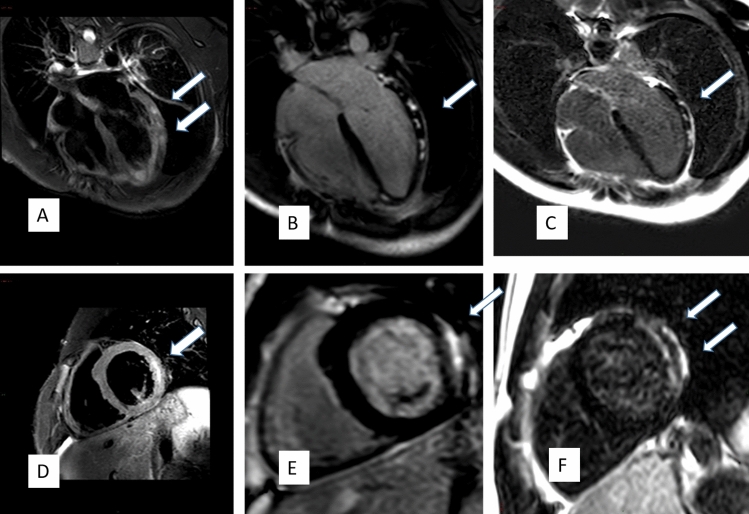
Fig. 1.
CMR Images of post COVID-19 Vaccination Myocarditis. 4CH T2 fat suppressed image showing increased signal indicating edema of the LV-free and lateral walls (A, D), patchy positive DLE (B, E) in the same distribution, and persistence of the DLE 5.5 months after patient presentation of the indicating scar formation (C, F)

