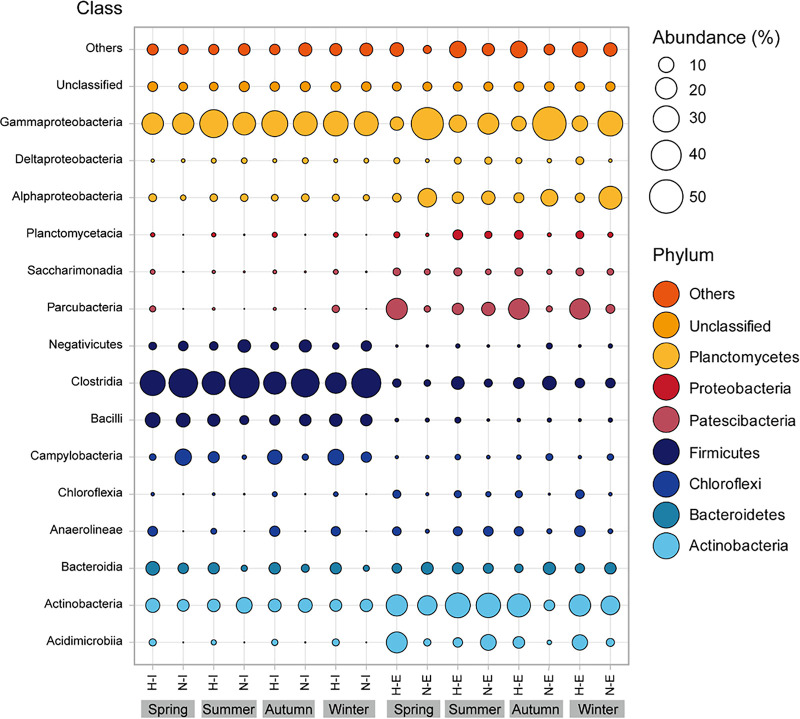
FIG 2.
Class level seasonal breakdown of the relative abundances of bacterial taxonomic groups. Classes belonging to the same phyla are represented by the same color. Bubble size corresponds to the relative abundance, and only major taxonomic groups (>1% total abundance) were included in the graphic. H-I, hospital influent; H-E, hospital effluent; N-I, non-hospital influent; N-E, non-hospital effluent. Phyla and classes with abundances <1% are designated as “Others.”

