
Figure 2.
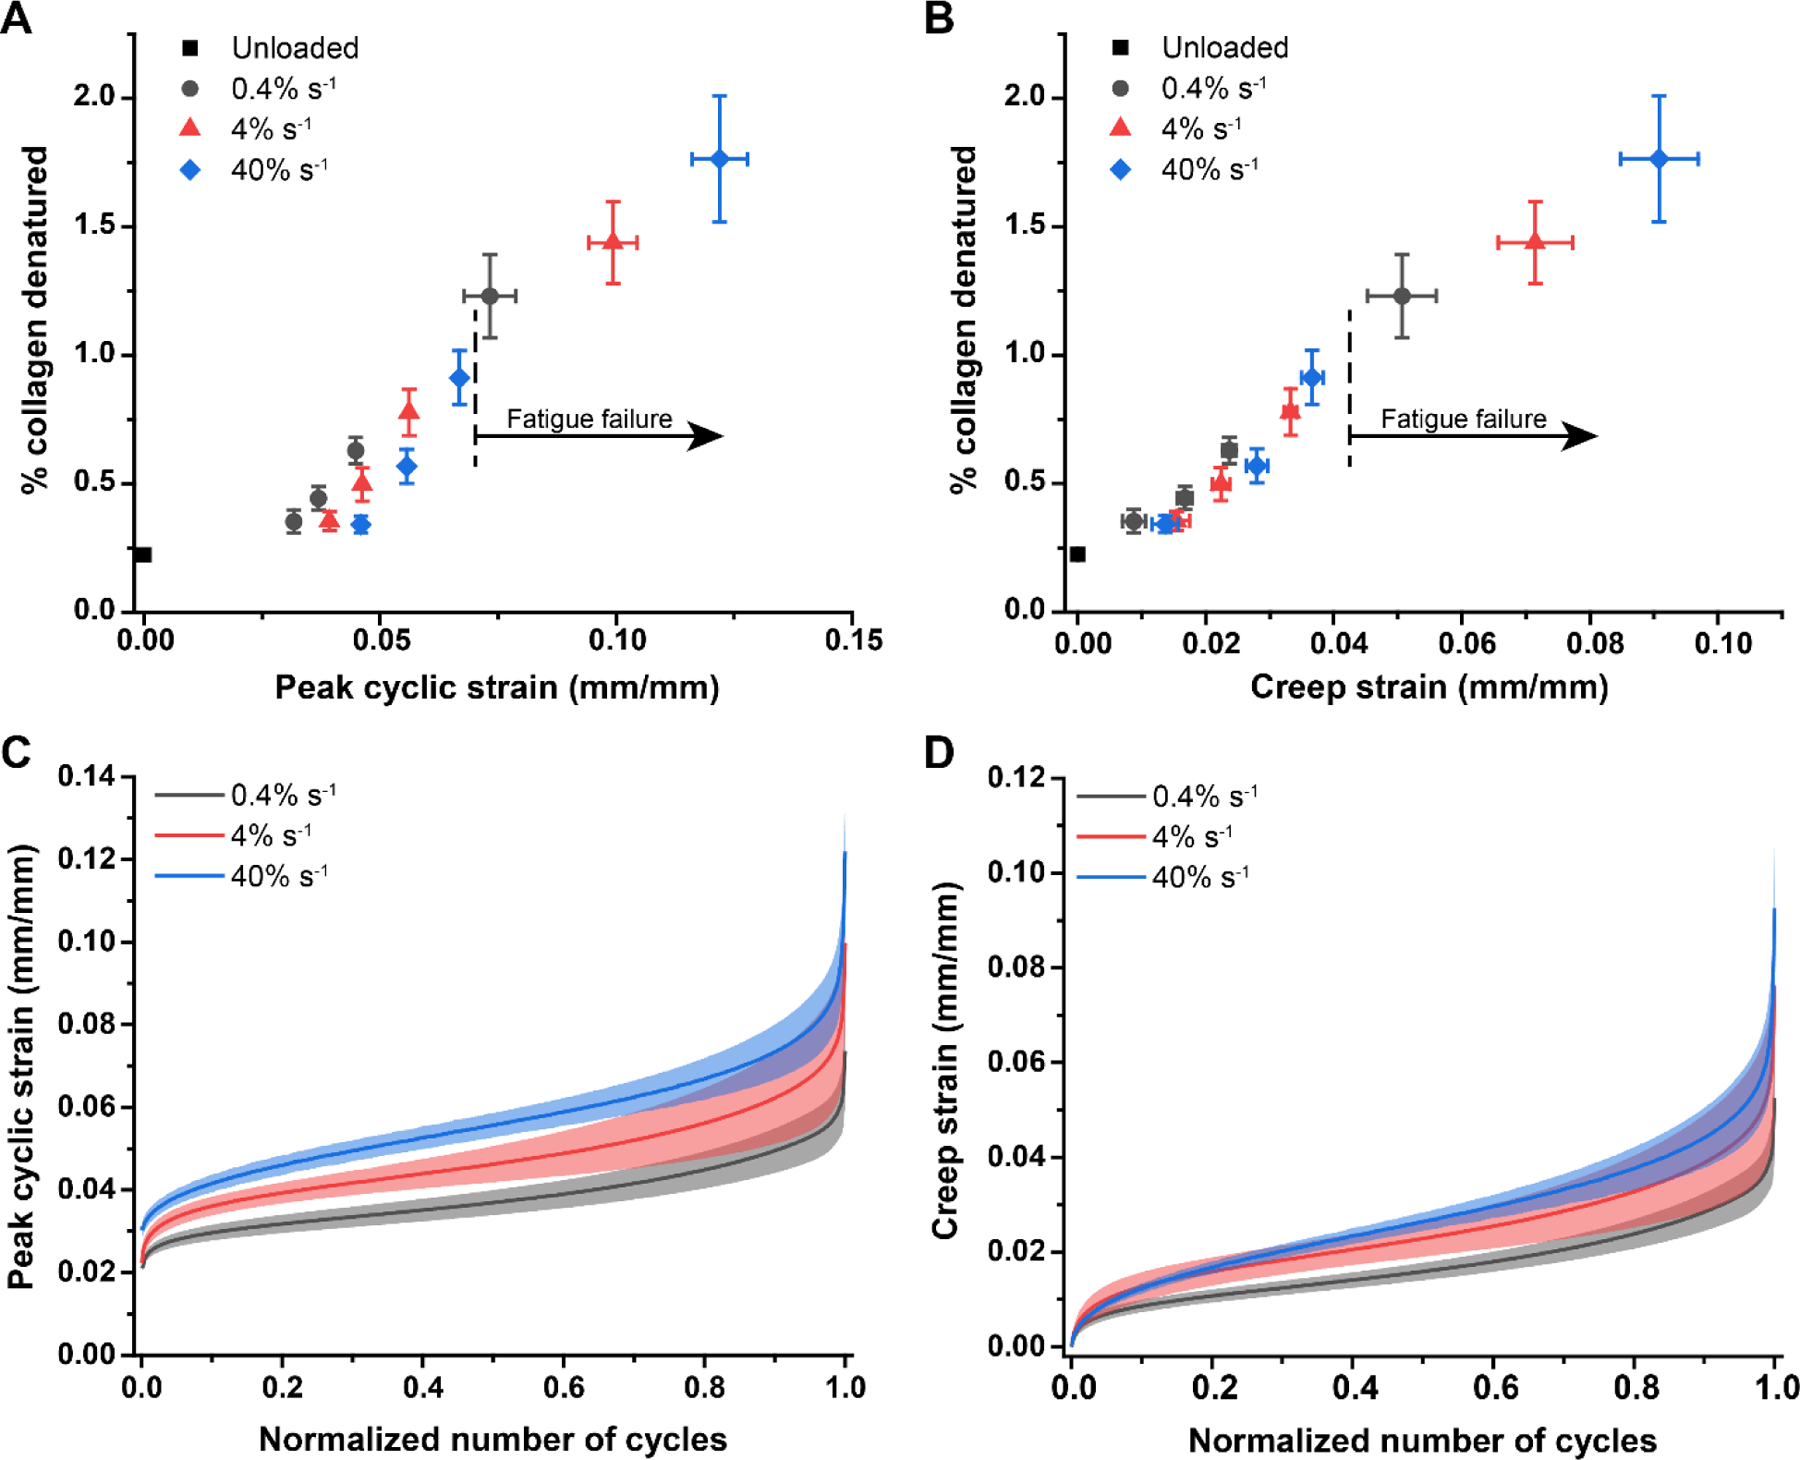
Percent denatured collagen as a function of peak cyclic strain and creep strain and strain-rate dependent fascicle creep. (A) The amount of denatured collagen increased with increasing peak cyclic strain and decreased with increasing strain rate (p<0.001 for both cases) but did not exhibit different rates of accumulation between strain rates (p=0.351). Interestingly, while samples loaded at higher strain rates accumulated less denaturation as a function of strain, they were able to withstand greater amounts of peak cyclic strain and thus denaturation before they failed (failure represented by the data point in each group). (B) When collagen denaturation was considered as a function of creep strain (normalized change in length from the peak of the first loading cycle), the overall effect of strain rate was not significant (p=0.738). However, it remained clear that samples loaded at faster strain rates withstood greater amounts of creep strain and thus denaturation before failing (failure represented by the last data point in each group). (C) Peak cyclic strain followed the typical triphasic creep pattern; high rates of creep were observed in the initial and final loading cycles, with a steady-state creep rate for the majority of the loading duration. There was a significant effect of strain rate, with higher peak cyclic strain at faster strain rates (p<0.001). (D) Creep strain similarly displayed a significant effect of strain rate (p<0.001) with samples experiencing more creep strain at faster strain rates as a function of the normalized number of cycles. Mean ± s.e.m.; n=6 per group except n=18 unloaded samples in (A) and (B). Mean ± s.d.; n = 10 per group in (C) and (D). Normalized number of cycles is the cycle number divided by the number of cycles to failure.