
Figure 4.
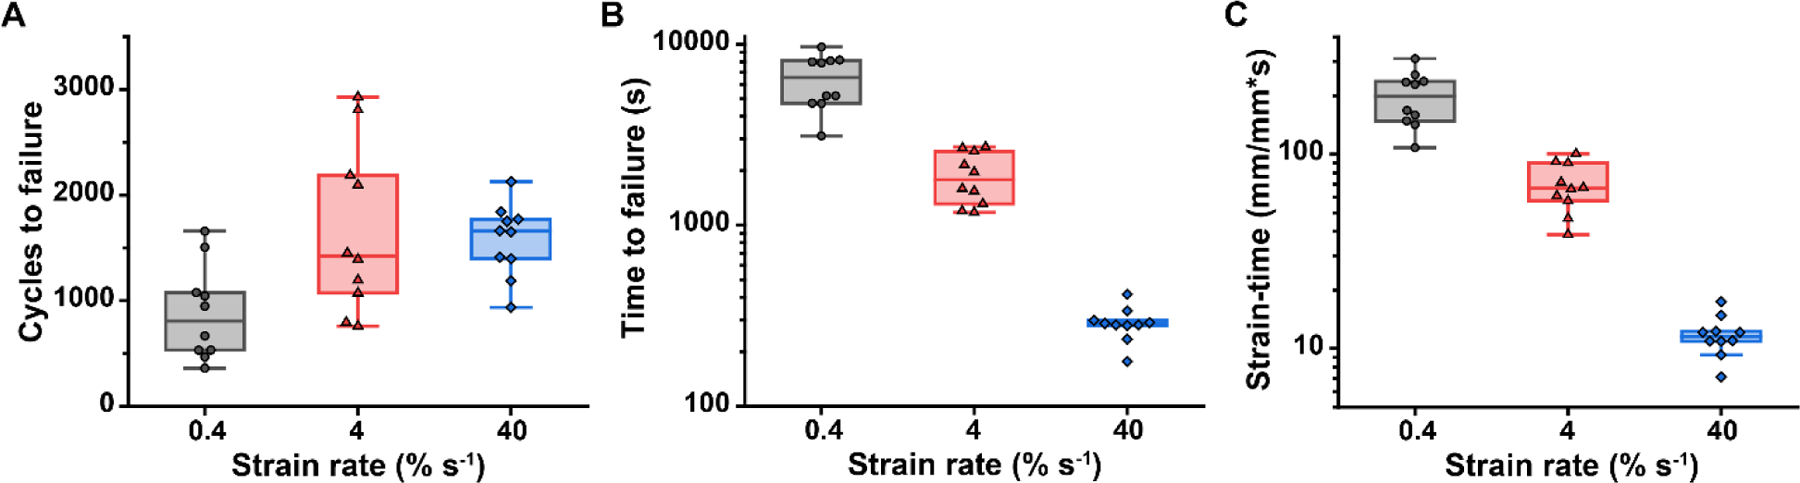
Fatigue resistance and fatigue lifetime as a function of strain rate. (A) The 4 and 40% s−1 groups exhibited a higher number of cycles to failure than the 0.4% s−1 group (p=0.003 and p=0.006, respectively). However, the number of cycles to failure exhibited high variability, consistent with previous studies of tendon fatigue, making it a poor predictor of tendon fatigue failure. (B) The fatigue lifetime exhibited a significant negative correlation with strain rate (p<0.001). This relationship was expected, as the number of cycles to failure was of the same order of magnitude between strain rates, but there was an order of magnitude difference between each of the strain rates. (C) The strain-time, a measure of the amount of time at strain or the strain history, also decreased with increasing strain rate (p<0.001). Median ± interquartile range (IQR) with whiskers representing the range within 1.5IQR. n=10 per strain rate; all data points are shown and were included in statistical analyses.