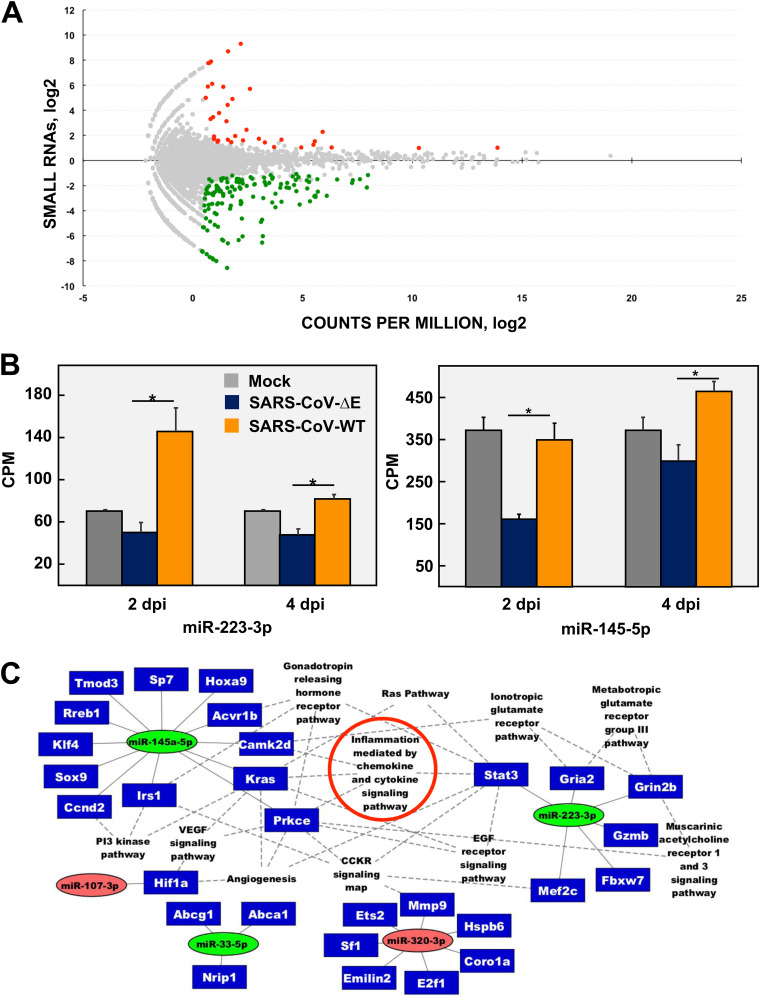
FIG 1.
microRNAs differentially expressed in the lungs of mice infected with the attenuated SARS-CoV-ΔE compared to the virulent SARS-CoV-WT. (A) The log2 ratio of small RNA expression in SARS-CoV-ΔE to SARS-CoV-WT infection at 2 days p.i. is represented on the y axis. The log2 counts per million (CPM) for each small RNA sequence is represented on the x axis. Colored dots represent small RNAs that were differentially expressed with |fold change| ≥ 2; FDR ≤ 0.05; and average raw counts ≥ 20. Upregulated sequences are indicated in red and downregulated sequences in green. (B) CPM of miRNAs 223-3p and 145a-5p differentially expressed in SARS-CoV-ΔE compared to SARS-CoV-WT infection are represented; *, |fold change| ≥ 2 and FDR ≤ 0.05. (C) miRTarBase regulatory network of interactions between annotated mouse miRNAs differentially expressed in SARS-CoV-ΔE versus SARS-CoV-WT infection and mRNA targets validated with strong experimental evidence. The functional groups with P value < 0.1 according to the Panther Classification System are shown; miRNAs are represented in colored ovals according to their differential expression in SARS-CoV-ΔE versus WT infection. Green ovals indicate upregulated miRNAs (fold change ≤ −2), while red ovals indicate downregulated miRNAs (fold change ≥ 2). Target genes are shown inside blue rectangles. Continuous lines represent miRNA–mRNA interactions and dotted lines indicate gene-pathway interactions. Small RNAseq results were obtained from n = 3 mice per experimental condition (i.e., infected with each virus or mock-infected and sacrificed at 2 or 4 days p.i.). Statistical significance was calculated by two-tailed Student´s t test. *, P value < 0.05.

