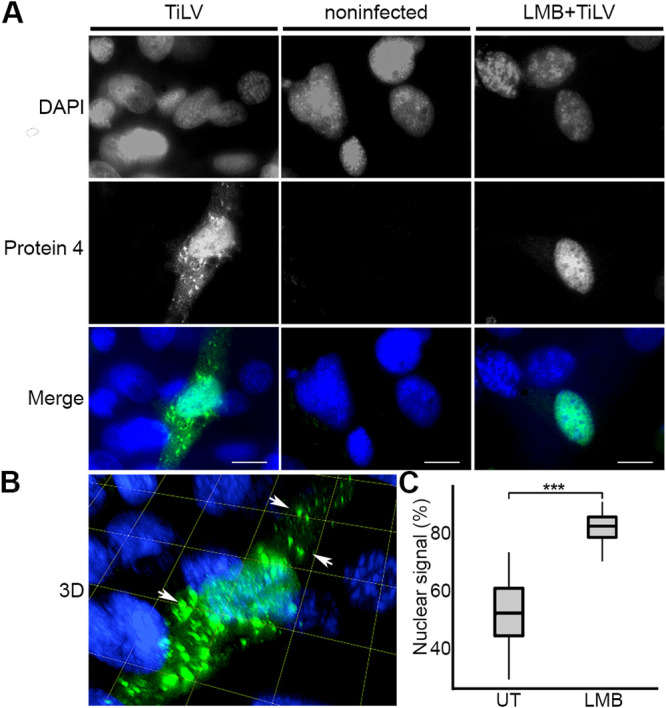
FIG 7.

Cytoplasmic and nuclear distribution of Protein 4. (A) OmB cell cultures were infected (MOI = 0.04) with TiLV (TiLV) or not (noninfected) or were treated with 45 nM LMB for 2 h and then infected with TiLV in the presence of LMB (LMB+TiLV). At 24 h postinfection, the cells were stained with αProtein4 antibodies and DAPI and imaged with a confocal microscope. Single optical sections of the cultures are shown, with DAPI and Protein 4 signals in grayscale and merged signals in color. (B) Serial optical sections of the TiLV-infected cell in panel A were reconstituted into a 3D image. Arrows point to Protein 4 puncta. Grid and bars represent 10 μm. (C) Boxplot of the average percentage of the nuclear signal of Protein 4 of 16 TiLV-infected and untreated cells (UT) and 19 infected, LMB-treated cells (LMB), described in panel A. For each cell, the percentage of the nuclear signal was determined by dividing the nuclear signal of Protein 4 by the total signal of this protein in the whole cell. ***, P ≤ 0.001 (Student’s t test).
