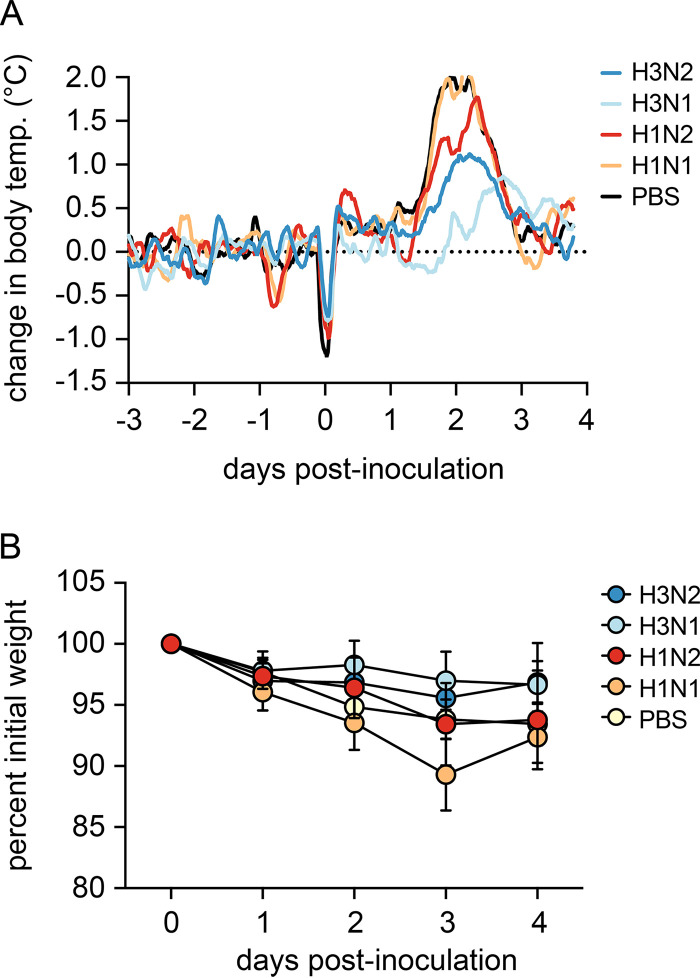
FIG 4.
Body temperature and weight loss in vaccinated ferrets after challenge with H3N2 virus. (A) Core body temperatures were recorded every 10 min with data loggers implanted in the peritoneal cavity of the ferrets. Baseline body temperatures were calculated by averaging measurements from the 3 days prior to challenge. Sliding means over 4 h were calculated for each animal, and data were plotted as the mean per group. (B) Weight loss was registered daily and is represented as the percentage of weight compared to the day of challenge. Values are the mean and standard deviation of each group.

