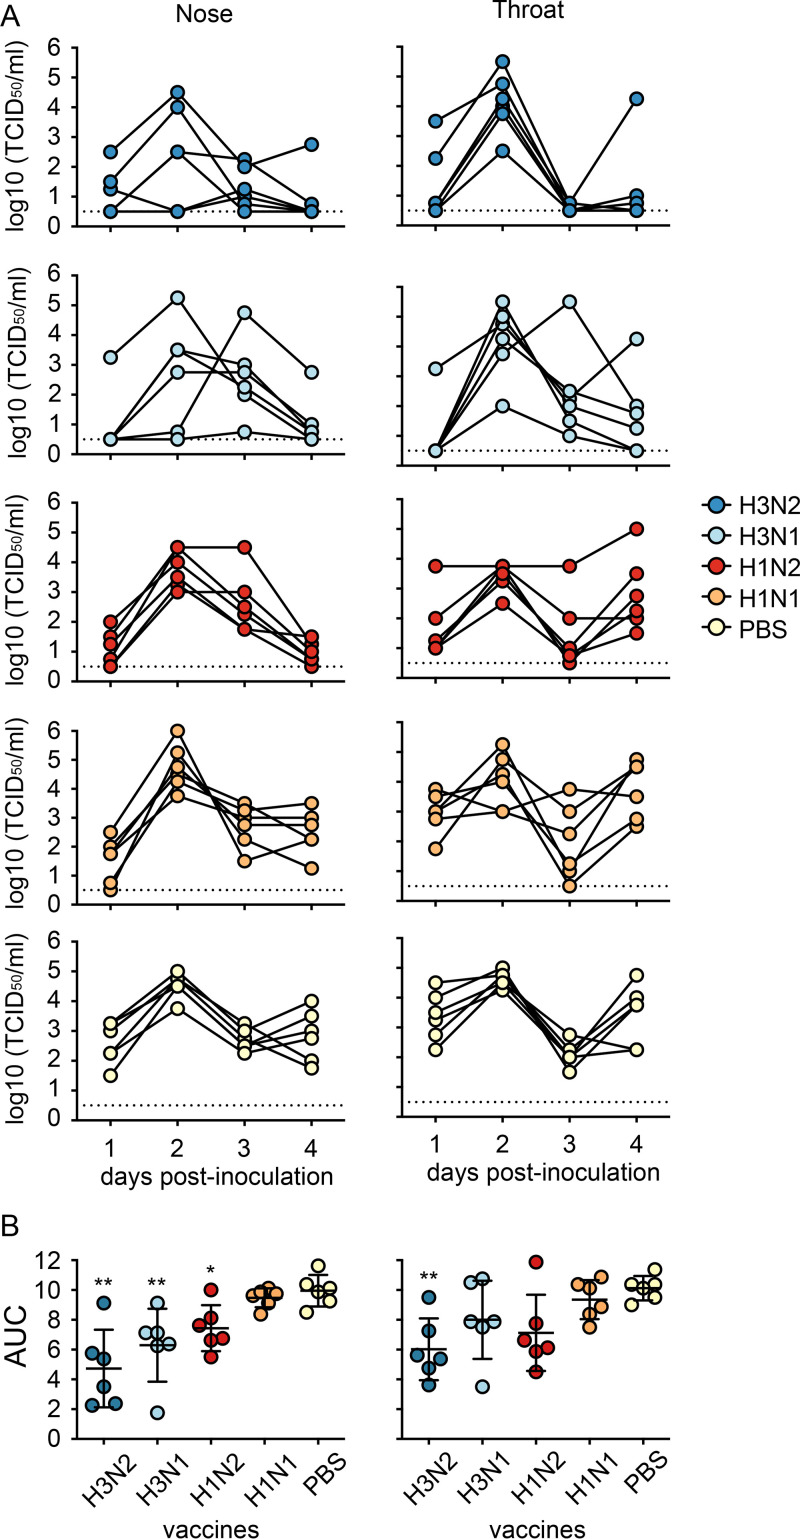
FIG 7.
Virus shedding from the throat and nose of vaccinated ferrets upon challenge with H3N2 virus. (A) A) Virus shedding is shown as A) shedding curves for individual animals and B) the mean and standard deviation of the areas under the curve per group (AUC). Colored circles represent individual animals. Doted lines represent the limit of detection. Statistical analyses were performed using Kruskal-Wallis followed by Mann-Whitney tests with GraphPad software. **, P < 0.01; *, P < 0.05; compared to the PBS group.

