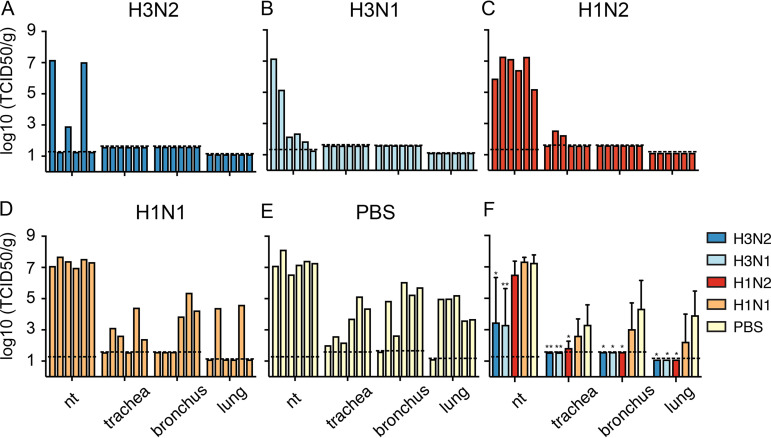
FIG 8.
H3N2 virus replication in the upper and lower respiratory tract of vaccinated ferrets at 4 dpi. (A to F) Each bar represents titers in one individual animal (A to E) or the geometric mean with standard deviation of each group (F). Dotted lines represent the limits of detection calculated for each organ. nt, nasal turbinates. Statistical analyses were performed using Kruskal-Wallis followed by Mann-Whitney tests with GraphPad software. **, P < 0.01; *, P < 0.05, compared to the PBS group.

