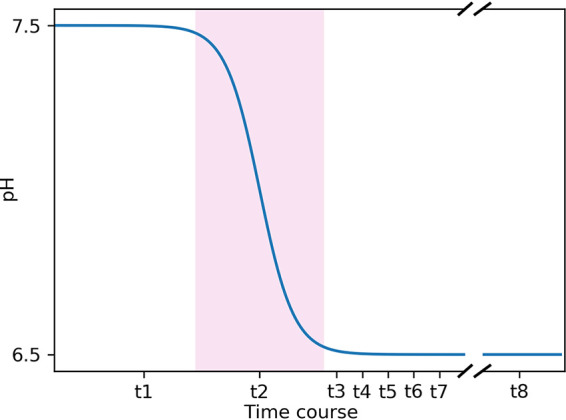
FIG 1.

Time course of the pH shift experiment. Samples were taken at t1 (steady-state at pH 7.5), t2 (the transition state [pink background] during the pH shift), t3, t4, t5, t6, and t7, which indicate data points at pH 6.5 at 80, 100, 120, 180, and 240 min after the start of the pH shift. Finally, samples were taken at t8, the steady-state at pH 6.5, 21 h after the start of the experiment. The distance between the data points does not represent the actual time difference in the experiment. Also, the break between t7 and t8 shows the shortened x axis between the two data points.
