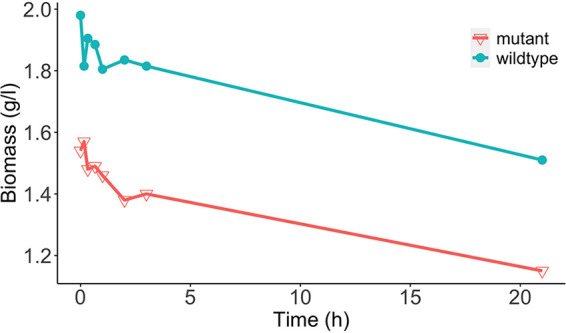
FIG 2.

Development of the biomass production over 21 h during the pH shift experiment. The red line shows the biomass values of the E. faecalis Δglna mutant, while the blue line shows the one of the wildtype. Each data point represents the mean of two biological replicates.
