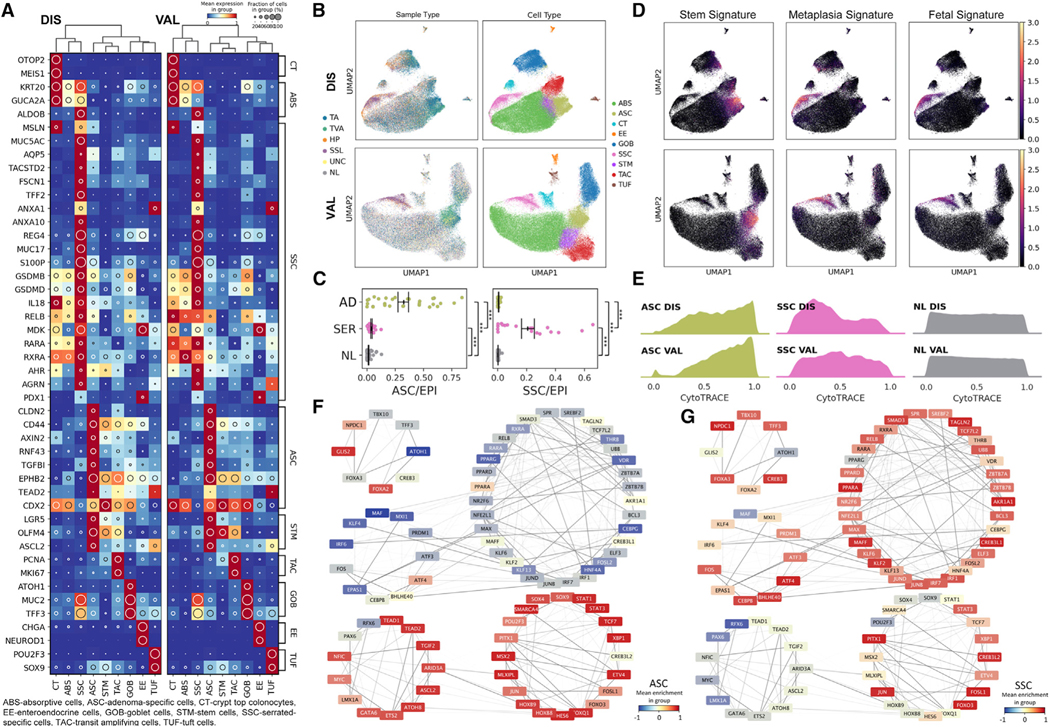
Figure 2. Single-cell gene expression and regulatory network landscape of pre-cancers.
(A) Heatmap of top biologically relevant and differentially expressed genes for (left) DIS (n = 62) and (right) VAL (n = 59) epithelial datasets. The inset circle indicates prevalence and intensity represents scaled expression.
(B) Regulon-based UMAPs of (top) DIS and (bottom) VAL epithelial datasets color overlaid with (left) tissue or (right) cell type.
(C) Scatterplots of normalized (left) ASC or (right) SSC representation per tissue subtype. Points represent individual specimens. Error bars represent SEM of n = 29 for AD, n = 19 for SER, and n = 66 for NL.
(D) Stem, metaplasia, and fetal signature scores overlaid onto UMAPs of (C).
(E) Ridge plots of CytoTRACE score distributions for ASC, SSC, and NL cell populations across (top) DIS and (bottom) VAL datasets.
(F and G) TF target network created from normal and pre-cancer cells, organized into super-regulons for (F) ASCs and (G) SSCs. Color overlays are regulon enrichment scores, while edge opacities are the inferred TF-target weightings. ***p < 0.001.

