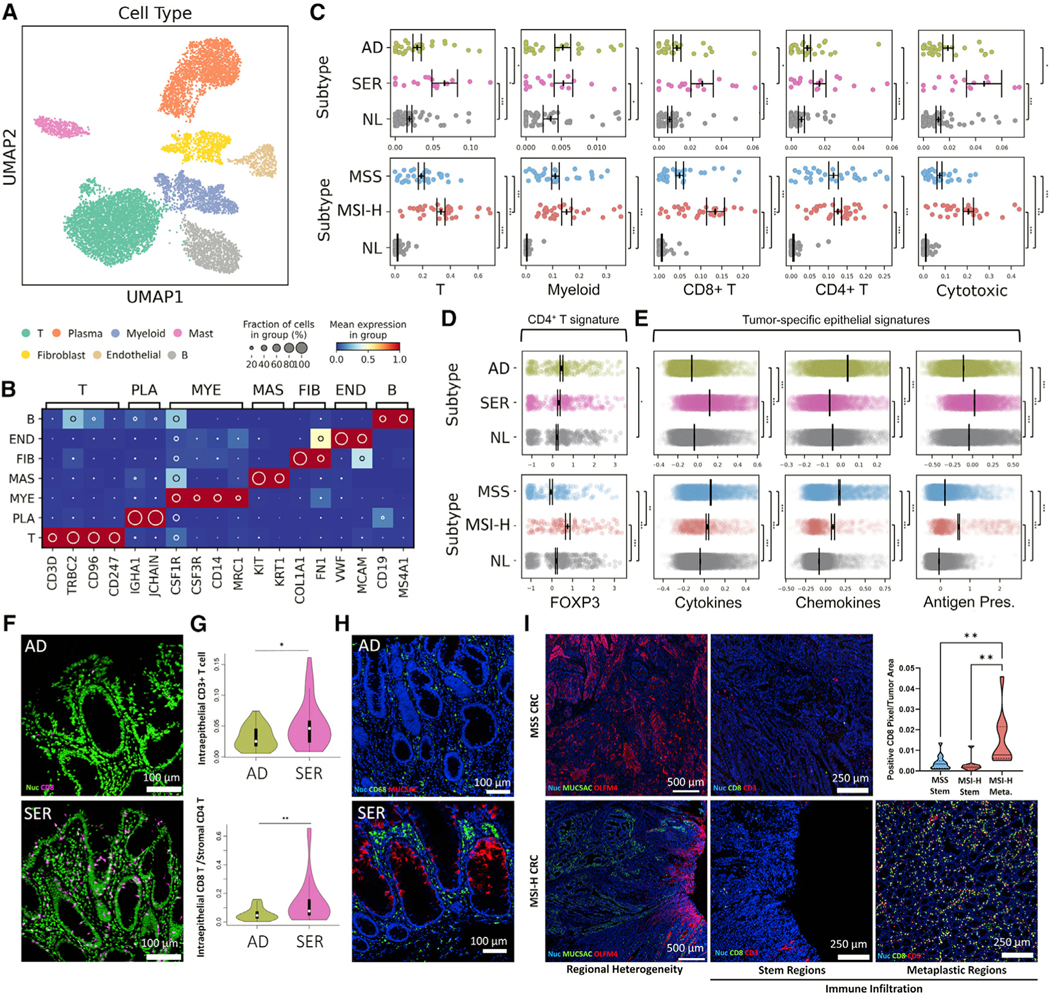
Figure 6. The immune landscape of colonic tumor subtypes.
(A) Regulon-based UMAP representation of non-epithelial cells.
(B) Heatmap of marker genes defining each cell type in (A). T - T cell, PLA - Plasma B cell, MYE - Myeloid, MAS - Mast, FIB - Fibroblast cell, END - Endothelial cell, B - B cell.
(C) Scatterplots of cell type representation of (top) polyp and (bottom) CRC subtypes. Points represent individual specimens. Error bars represent SEM of n = 28 for AD, n = 17 for SER, n = 66 for NL, n = 33 for MSS, and n = 34 for MSI-H.
(D and E) Scatterplots of (D) CD4+ T cell and (E) tumor cell-specific signature scores, with each point representing a single cell. Error bars depict SEM of single cells.
(F) MxIF images of CD8+ cells in polyps.
(G) Image quantification of intraepithelial CD8+ cells for n = 20 polyps per type.
(H) MxIF images of CD68+ and MUC5AC+ in cells in polyps.
(I) MxIF scans of intratumoral heterogeneous regions within CRCs (OLFM4+ stem regions versus MUC5AC+ metaplastic regions). MSS CRC only has stem regions. MxIF images of CD8 and CD3 within stem and metaplastic regions. The inset is the quantification of CD8-positive pixels in these regions from MxIF scans of n = 15 MSS and n = 10 MSI-H CRCs.
*p < 0.05, **p < 0.01, ***p < 0.001. See also Figure S6 and Tables S3, S4, and S5.

