
FIGURE 5.
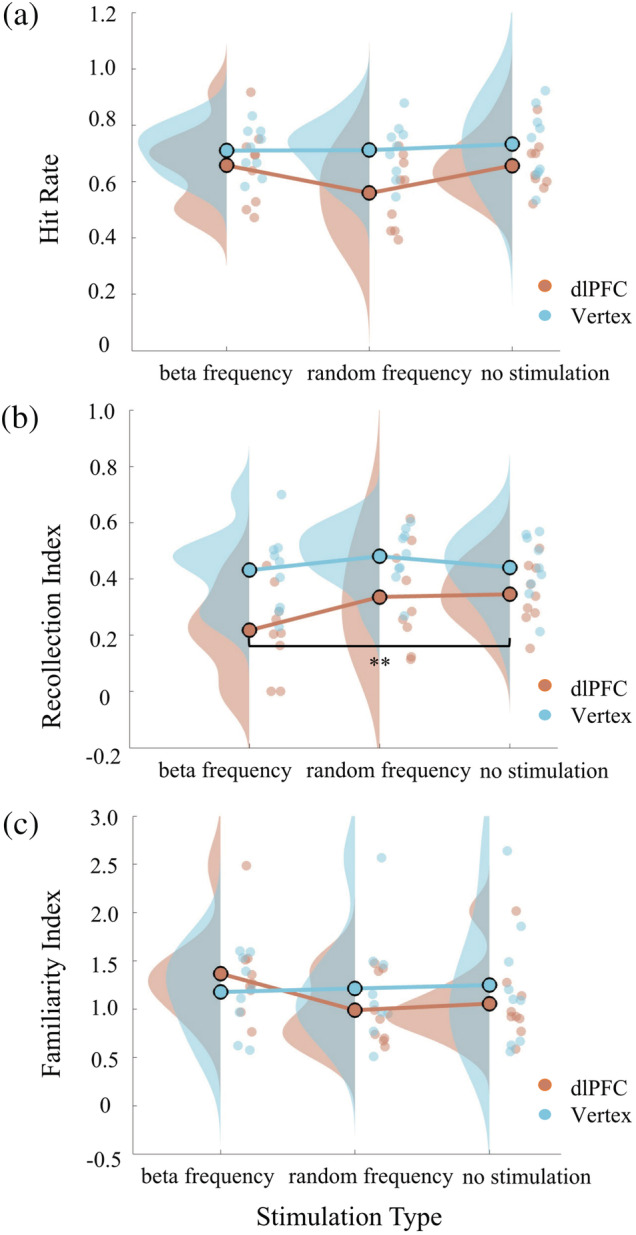
Between‐block analysis for the effects of transcranial magnetic stimulation (TMS) upon hit rate, recollection and familiarity indices in Experiment 2. Panels (a)–(c): Raincloud plots presenting the hit rate in match choice trials (Panel a), the mean recollection index (Panel b) and familiarity index (Panel c) in dlPFC (red) and vertex (blue) under beta frequency stimulation, random frequency stimulation and no stimulation. Circles are individual data; circles with black edge colour show the average of group data; distributions show probability density function of data points. ** indicates p < .01